


Goldman Sachs (NYSE: GS) – Bullish Trend is Still Intact
Companies / Company Chart Analysis Dec 14, 2018 - 10:15 AM GMT

 Ayoub Ben Rejeb : Since the 2008 Financial Crisis, Goldman Sachs (NYSE: GS) established a new multi-year bullish trend which managed to break above 2007 peak after just 10 years joining the list of many other stocks which already achieved new all time highs in the previous years.
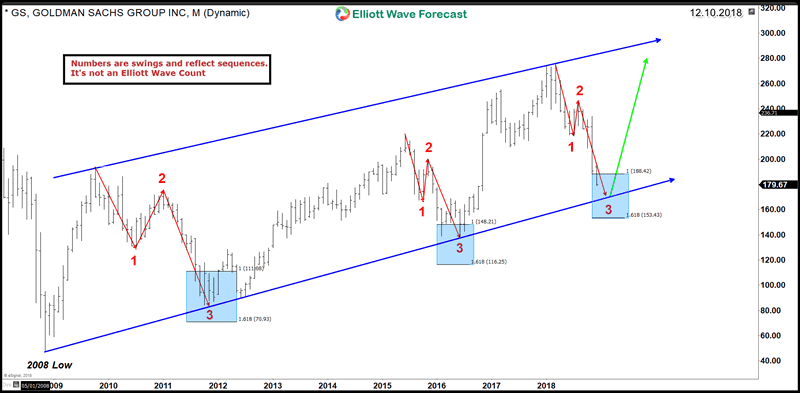
GS has been moving within a bullish channel making higher highs and higher lows. Every correction took place in a form of 3 swings lower into a blue box which is a High-frequency area where the market is likely to end cycles and make a turn. Now, the stock is approaching the lower end of the channel from where ideally the stock will be able the resume the move to the upside as long as the trend remain intact.
Goldman Sachs Monthly Chart
To understand the type of the 3 swings taking place at this stage, we switch to daily chart of GS and analyse the structures using the Elliott Wave Theory :
Goldman Sachs Elliott Wave Daily Chart
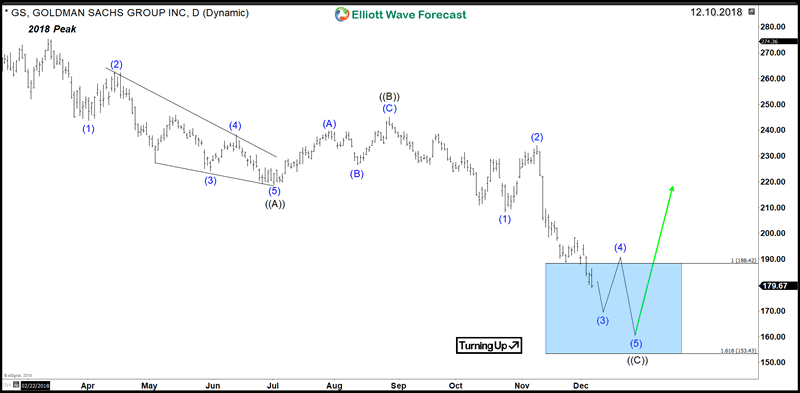
Since 2018 Peak, GS started the decline lower in a proposed classical ZigZag structure forming a corrective 3 waves move ((A)) – ((B)) – ((C)). The Stock has already reached the minimum target around the 100% Fibonacci extension area $188 with an extreme level at the 161.8% Fibonacci extension $153.4. Up from there, we expect the stock to react higher and resume the bullish trend looking for new all time highs or at least 3 waves bounce to the upside. However, if GS manage to exceed lower the extreme area then the move lower could turn into an impulsive structure to the downside ending the bullish trend since 2009 and could be starting a larger degree correction.
Corrections are always part of a healthy trend and can present a good opportunity to join it. Consequently, investors can be looking for a Long position within the mentioned buying area with a clear invalidation level.
Get more insights about the Financial Sector and it’s related stocks by trying out our services 14 days to learn how to trade our blue boxes using the 3, 7 or 11 swings sequence. You will get access to our 78 instruments updated in 4 different time frames, Live Trading & Analysis Session done by our Expert Analysts every day, 24-hour chat room support and much more.
EWF Analytical Team
https://elliottwave-forecast.com
ElliottWave-Forecast has built its reputation on accurate technical analysis and a winning attitude. By successfully incorporating the Elliott Wave Theory with Market Correlation, Cycles, Proprietary Pivot System, we provide precise forecasts with up-to-date analysis for 52 instruments including Forex majors & crosses, Commodities and a number of Equity Indices from around the World. Our clients also have immediate access to our proprietary Actionable Trade Setups, Market Overview, 1 Hour, 4 Hour, Daily & Weekly Wave Counts. Weekend Webinar, Live Screen Sharing Sessions, Daily Technical Videos, Elliott Wave Setup .
Copyright © 2018 ElliottWave-Forecast - All Rights Reserved Disclaimer: The above is a matter of opinion provided for general information purposes only and is not intended as investment advice. Information and analysis above are derived from sources and utilising methods believed to be reliable, but we cannot accept responsibility for any losses you may incur as a result of this analysis. Individuals should consult with their personal financial advisors.
© 2005-2022 http://www.MarketOracle.co.uk - The Market Oracle is a FREE Daily Financial Markets Analysis & Forecasting online publication.