


Stock Market Looking Toppy!
Stock-Markets / Stock Markets 2019 Jan 13, 2019 - 05:37 PM GMTBy: Andre_Gratian

 Current Position of the Market
SPX: Long-term trend – Correcting within the very long-term bull market trend.
Intermediate trend – A bearish correction has started which could retrace as low as 2200 before it is complete
Analysis of the short-term trend is done on a daily basis with the help of hourly charts. It is an important adjunct to the analysis of daily and weekly charts which discusses the course of longer market trends.
Daily market analysis of the short term trend is reserved for subscribers. If you would like to sign up for a FREE 4-week trial period of daily comments, please let me know at ajg@cybertrails.com
Looking Toppy!
Market Overview
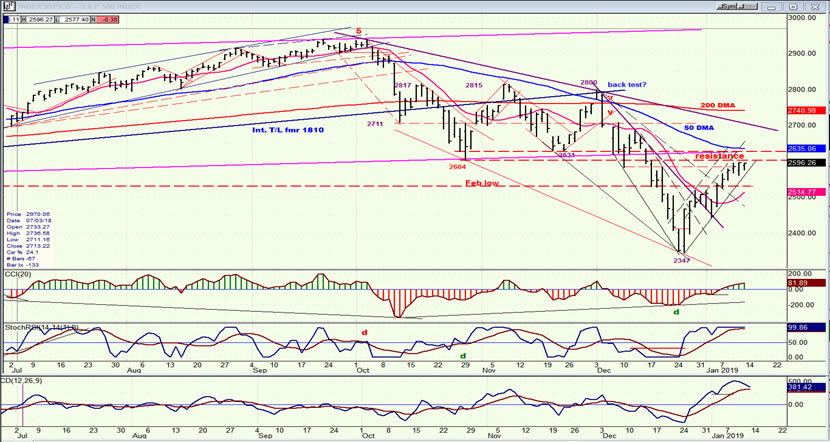
After a three-month decline of nearly 600 points, SPX was more than ready for an oversold rally. The end of the initial down-phase of an intermediate to long-term correction which is expected to last for several more months finally came at 2346 and, only two weeks later, it has already retraced forty percent of the downtrend. One of the hallmarks of the recent market action is extreme volatility, such as has not been seen since the 1930s, whereby the Dow had a range of as much as 1152 points in a single day (12/26/18)! In the last few days, it has died down to a whimper. Does it spell a total loss of upside momentum?
When the counter-trend rally started, I suspected that it could reach as high as 2625 before coming to an end. Over the past three days, it has encountered resistance at ~ 2595 and, although on Friday it did close on its high of the day and within a point from the high of the move from 2346, I am not sure that it can make it all the way to the projected target (which is based on a combined P&F and Fib projection) before reversing. Of course, it can be helped or hindered by events transpiring over the weekend, and we’ll have to wait until Monday to see if it can move a little higher before calling it quits.
Cycles suggest that we are in a topping area and that the next low point in the market could be about a month away. As of now, nothing suggests that we are heading for a new low in the primary trend. In fact a new low may not come for several more months. In the meantime, trading in a broad range in the foreseeable future is what is anticipated by cycle analyst Eric Hadik.
Chart Analysis (The charts that are shown below are courtesy of QCharts)
SPX daily chart
In the last letter, I pointed to the overhead resistance band corresponding to P&F and Fibonacci projections for the counter-trend rally which started at 2346. This is the approximate level where I felt we should look for a reversal. Last week saw a new high for the move to 2597 punctuated by some price deceleration in the past three days, when the index could not immediately punch through that level. However, with Friday’s close at the weekly and daily high, the odds of going all the way to 2620-25 are still good.
The deceleration is particularly evident in the breadth indicator, which tends to be ahead of the momentum oscillators to warn of a nearby reversal. You can see on the daily indicators that it has already turned down while the momentum only shows a flattening process. This will be much more evident when we look at the hourly chart.
We can also see that the bullish price trend line could be challenged over the next day or so. Since the projection still lies thirty points higher, the first challenge could result in a bounce off the line before the index goes through it. Adding to the perception of a top in this time frame is the cyclical pattern which had originally been discussed pointing to 1/11-1/14, and has now been fulfilled.
After the strong rally from the low, there is already a debate as to whether 2346 was the low of the bear market. This is premature and there is general agreement that we should at least re-test the low. What kind of a retest will become clearer after we have completed the current rally and can assess the top that has been formed and what kind of a potential decline can result from it From a cyclical standpoint, three or four weeks of correction can be expected. What comes after the retest will be even more prone to debate, since the counter-trend rally may only be completing phase-a at this time.
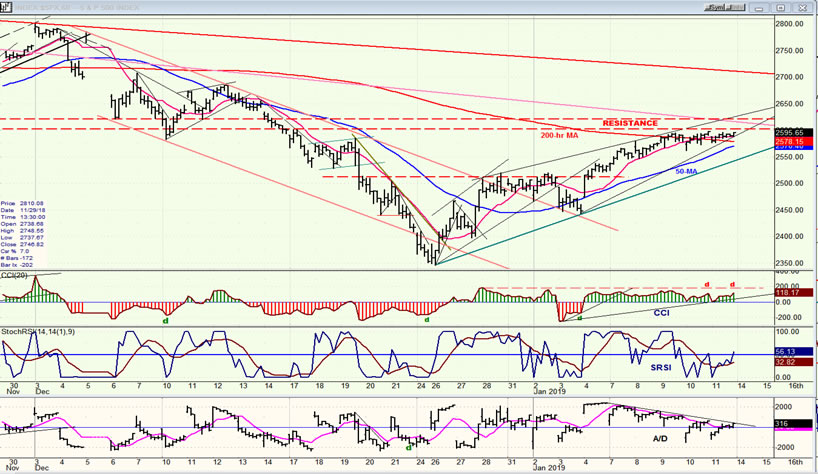
SPX hourly chart
The resistance band shown on the chart ranges between 2600 and 2620 and corresponds to the projections discussed earlier, but resistance actually extends all the way to 2675-2680 and the rally would have to reach beyond those levels before arousing suspicion that this is more than a counter-trend rally. The cycles/projections combination makes this extremely unlikely at this time; although a higher bear market rally high will probably occur if it evolves as an a-b-c pattern before the primary downtrend resumes. How much higher the current rally will actually extend is still unclear but, until an actual sell signal has been given, there is no confirmation that the move is over.
The A/D index has shown consistent selling for the past few days but it has not been able to remain negative for more than two or three hours. When it does, it should be the end of the rally. The SRSI is making the same pattern and has not been able to get back above the mid-line, but the CCI needs to become negative and stay negative for a decline to take hold.
Trading is still taking place inside the bullish channel and above the trend line. The index will have to go outside of it to give a sell signal. Whether or not it does so immediately or waits a couple more days, we should not have much longer to wait.
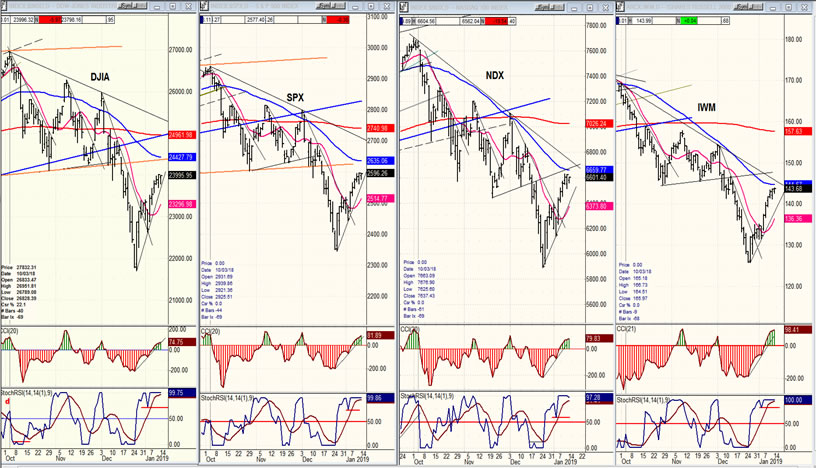
DJIA, SPX, IWM, NDX (daily)
NDX had the strongest rally, since it is the only one which penetrated the former short-term lows. The oscillators of all four are at their tops an look just about ready to roll over.
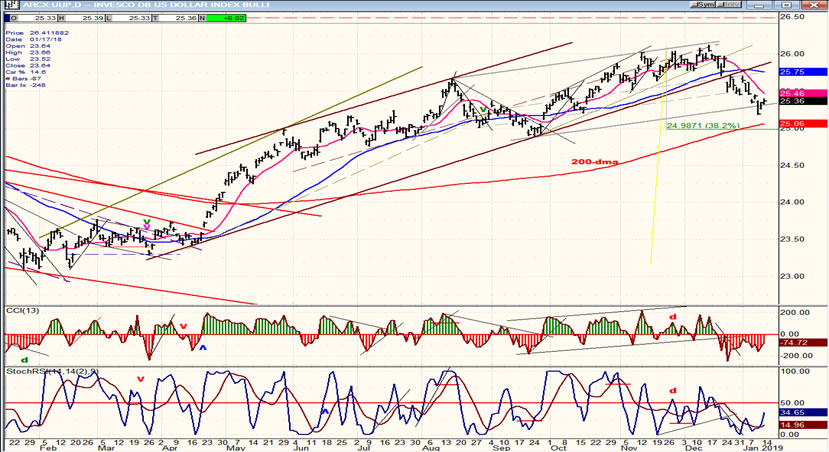
UUP (Dollar ETF) (daily)
UUP has now given a sell signal but may find near-term support on the bottom channel line -- and more of it when it gets down to its 200-dma.
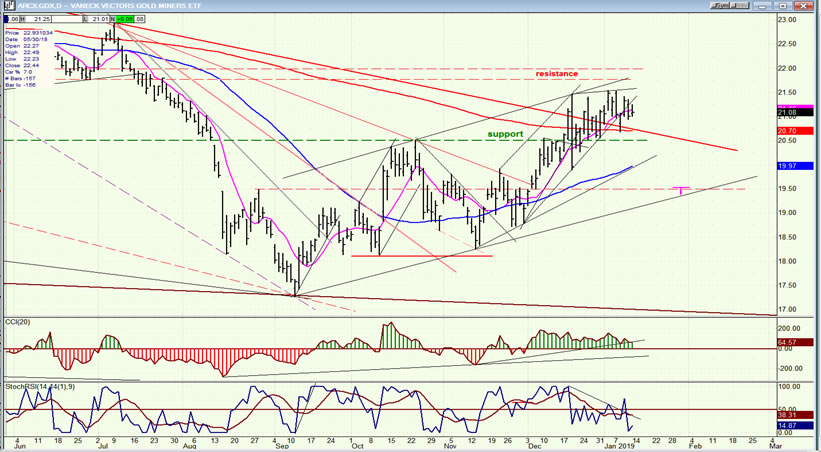
GDX (Gold miners ETF) (daily)
GDX has met its initial target of 21-21.50 and is consolidating. If it cannot make a new high over the near term, it may have to extend its correction into the end of the month.
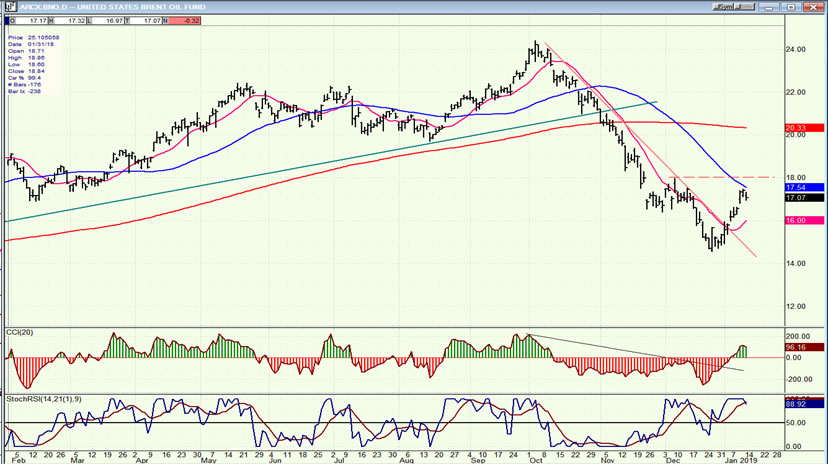
BNO (United States Brent Oil Fund) (daily)
BNO has bounced off its low and will probably have to retest it; and perhaps even form a base before it can move beyond 18.00.
Summary
SPX is nearing its projection and preparing to reverse as the initial phase of its counter-trend rally comes to an end. By next week, we should be able to have a good idea of how far its retracement will carry.
Andre
FREE TRIAL SUBSCRIPTON
With a trial subscription, you will have access to the same information that is given to paid subscribers, but for a limited time period. I think you will find that knowing how far a move can carry is one of the most useful benefits of this service, whether you are a trader or an investor -- especially when this price target is confirmed by reliable indicators which give advance warning of a market top or bottom. Furthermore, cycle analysis adds the all- important time element to the above price projections.
For a FREE 4-week trial, further subscription options, payment plans, and for general information, I encourage you to visit my website at www.marketurningpoints.com.
Disclaimer - The above comments about the financial markets are based purely on what I consider to be sound technical analysis principles uncompromised by fundamental considerations. They represent my own opinion and are not meant to be construed as trading or investment advice, but are offered as an analytical point of view which might be of interest to those who follow stock market cycles and technical analysis.
Andre Gratian Archive |
© 2005-2022 http://www.MarketOracle.co.uk - The Market Oracle is a FREE Daily Financial Markets Analysis & Forecasting online publication.