


Will the Stock Market and U.S. Dollar Fall Together Soon?
Stock-Markets / Stock Markets 2019 Jan 25, 2019 - 08:12 AM GMTBy: Troy_Bombardia

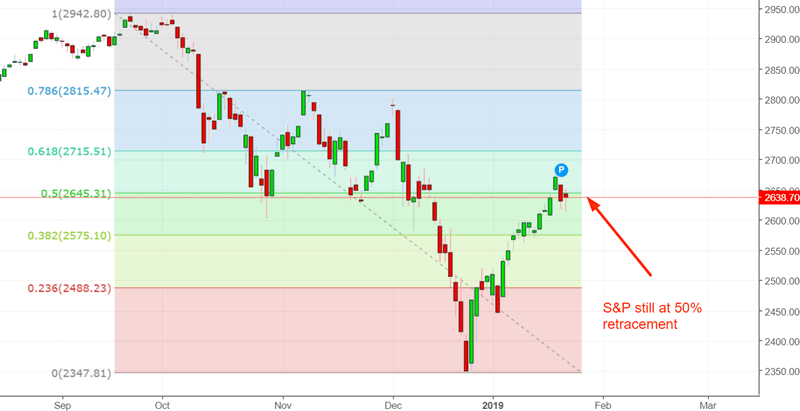
With the stock market stuck at its 50% fibonacci retracement, many traders are looking for a pullback/retest. While the Q4 2018 stock market decline coincided with a flat U.S. Dollar, there’s a high probability that the next pullback/retest will coincide with a falling U.S. Dollar.
Go here to understand our fundamentals-driven long term outlook.
Let’s determine the stock market’s most probable medium term direction by objectively quantifying technical analysis. For reference, here’s the random probability of the U.S. stock market going up on any given day.

*Probability ≠ certainty. Past performance ≠ future performance. But if you don’t use the past as a guide, you are blindly “guessing” the future.
Weakening macro
Macro data remains limited due to the ongoing government shutdown. But with the macro data that is available, macro is mixed-to-weak.
Here’s the Chemicals Activity Barometer, a semi-useful leading indicator for the U.S. stock market.
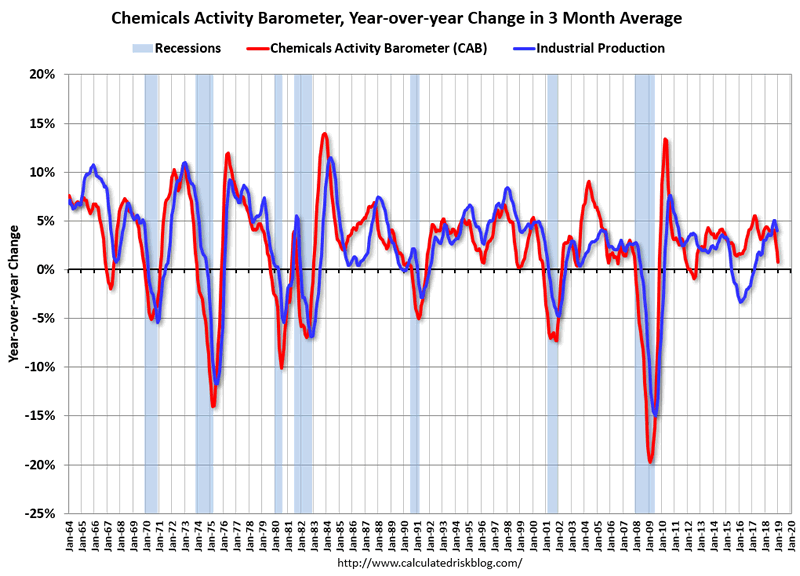
*From Bill McBride at Calculated Risk, one of the few good economists.
As you can see, the Chemical Activity Barometer is dropping sharply right now. Should this continue, the Chemical Actiity Barometer’s year-over-year change in 3 month moving average will turn negative for the first time since 2012.
Here’s what happens next to the S&P 500 when the Chemical Actiity Barometer’s year-over-year change in 3 month moving average turns negative for the first time in 1 year.
*Data from 1923 – present
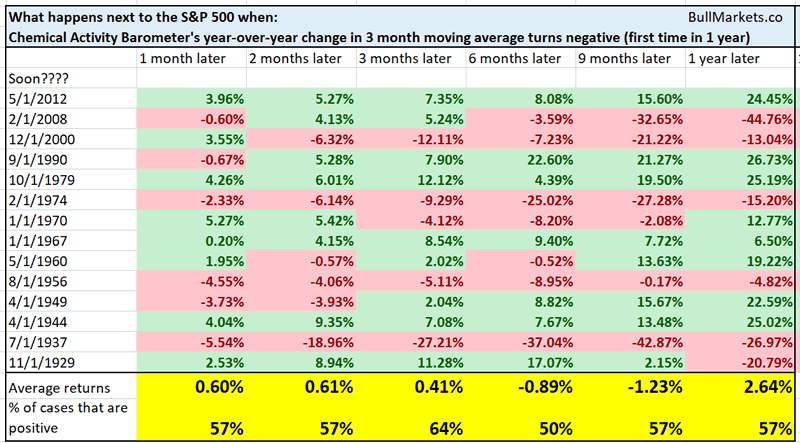
As you can see, forward returns aren’t terrific. Although this indicator does have some false signals (e.g. 2012), a negative reading usually precedes a recession.
- Recession + low valuations = 20% decline in the S&P 500
- Recession + high valuations (e.g. right now) = much bigger decline in the S&P 500.
This isn’t a long term bearish sign for the U.S. stock market right now, but will be soon if this indicator turns negative.
50 day moving average
The S&P 500 is holding above its 50 day moving average. Is this a “sustained breakout”?
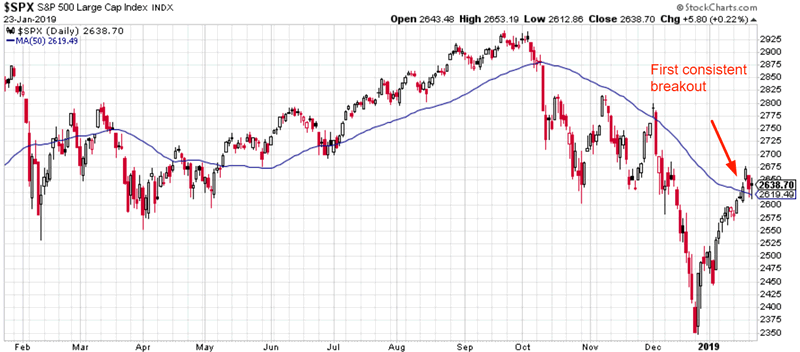
Here’s what happens next to the S&P when it closes above its 50 dma for 4 consecutive days, for the first time in 3 months
*Data from 1950-present
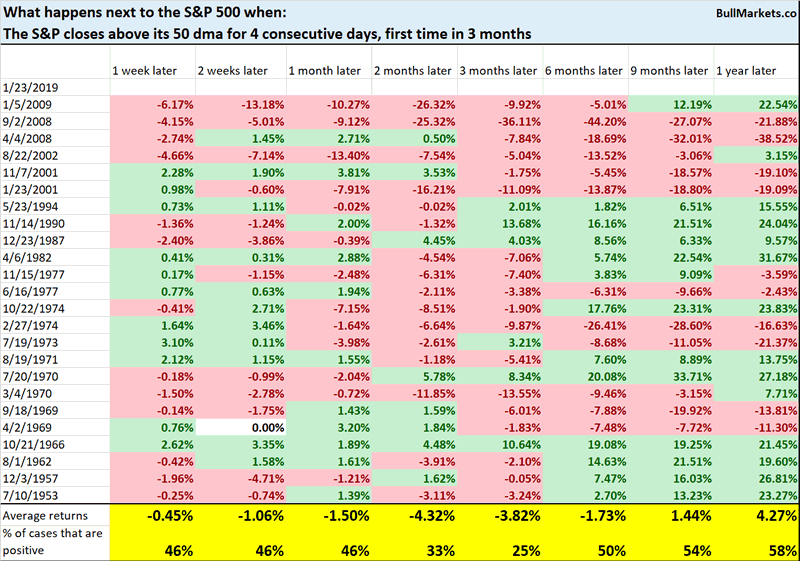
As you can see, there’s a strong tendency for the stock market to fall over the next 2-3 months. Why?
When the S&P is below its 50 dma for 3 consecutive months, it means that the S&P has been in a long and persistent downtrend. As we’ve shown in the past, sharp downtrends are usually followed by a bounce to the 50% retracement, and then a pullback/retest.
Macro Context
NASDAQ
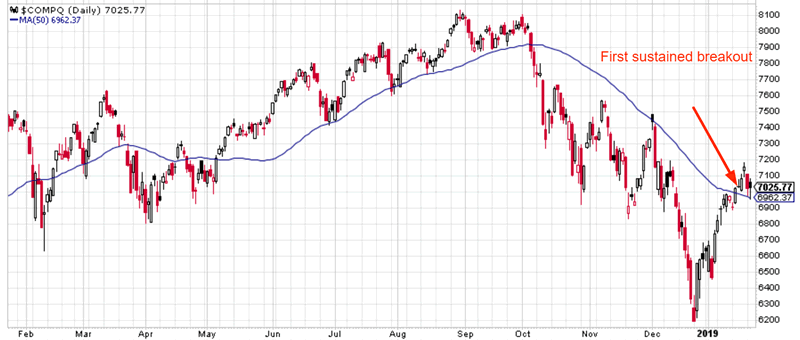
Like the S&P the NASDAQ has closed above its 50 dma for 4 consecutive days, for the first time in 3 months.
Here are similar cases, and what the NASDAQ did next.
*Data from 1971-present
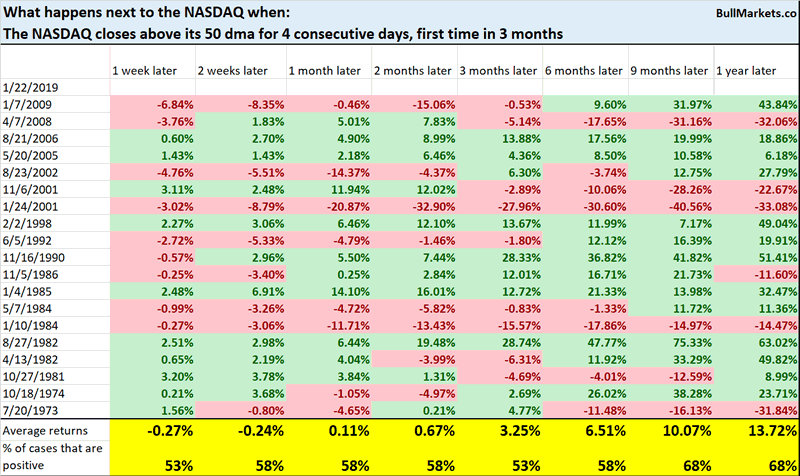
As you can see, the NASDAQ’s forward returns are mostly random.
So why isn’t this as bearish for the NASDAQ as it is for the S&P 500?
The NASDAQ’s price action is a little different from the S&P 500. The NASDAQ (and the Russell 2000) tend to go up and down in straight lines more often than the S&P 500 does.
Macro Context
Gold and silver
After breaking out above its 200 dma, silver has once again broken below this moving average.
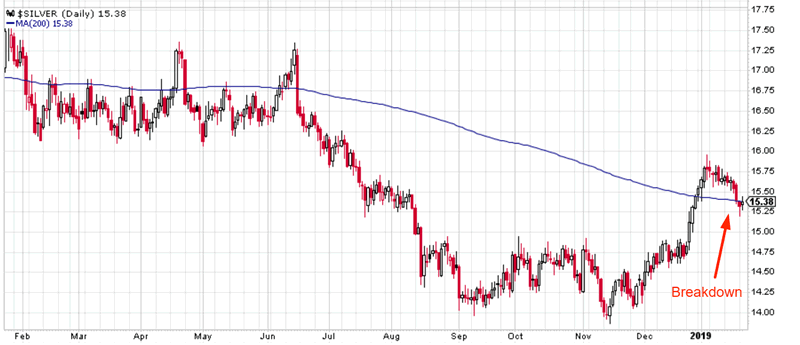
Gold and silver experienced very long and sustained downtrends from June-November 2018. A few months ago I said that “although gold and silver will make an oversold rally soon, that rally will not be sustained. Such long precious metals downtrends ARE NOT characteristic of gold and silver bull markets”.
Here’s what happens next to silver when silver rises above its 200 dma for the first time in half a year (e.g. December 2018), and then falls below its 200 dma within 1 month (e.g. right now).
*Data from 1970-present
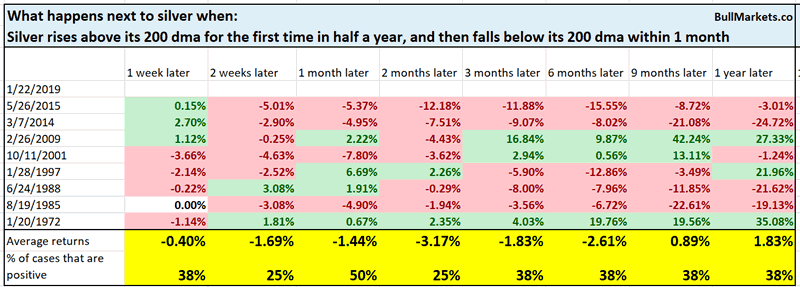
As you can see, silver’s forward returns are not good.
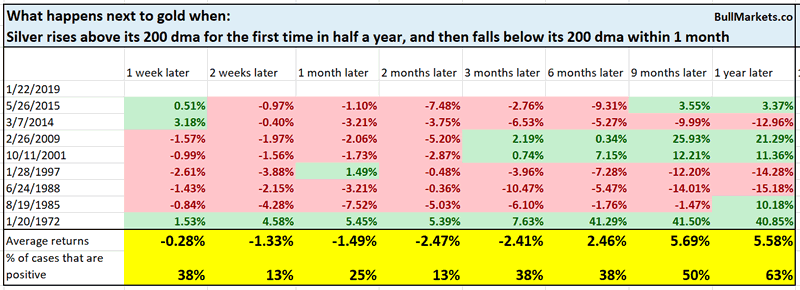
Here’s the same study, but applied to gold. Gold’s forward returns aren’t good either.
U.S. Dollar Index
While the U.S. stock market experienced massive volatility in Q4 2018, the U.S. Dollar Index went nowhere.
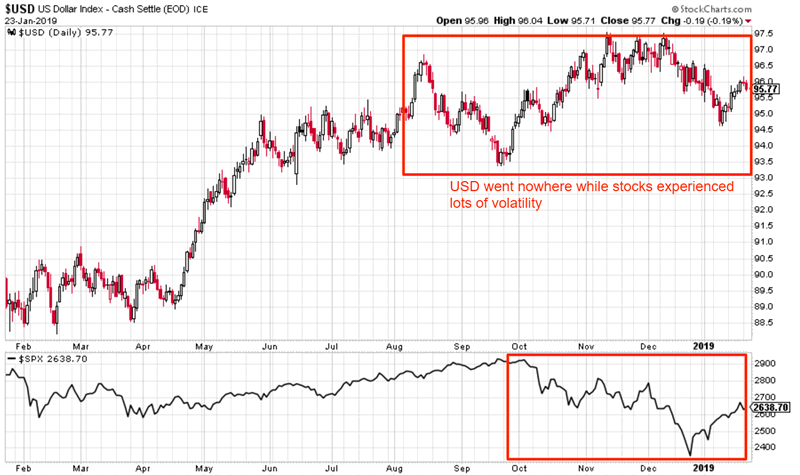
This is uncommon, because the USD often either spikes when the stock market tanks, or falls along with the stock market.
Here’s what happens next to the S&P 500 when the S&P witnesses at least 33 1% moves in the past 70 days, while the USD Index is within 1% (up or down) of where it was 70 days ago.
*Data from 1971-present
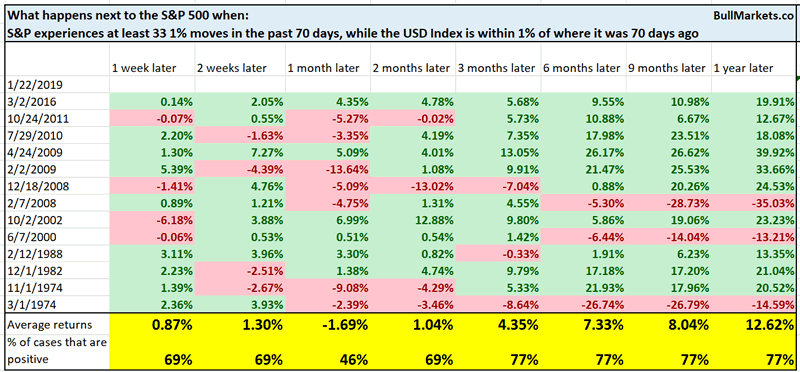
As you can see, the stock market’s forward returns are mostly random.
However, this is a bearish factor for the USD over the next 2-3 months.
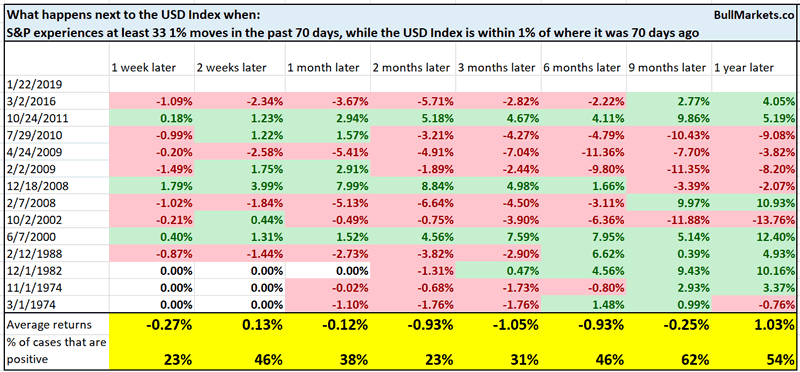
Perhaps the stock market will pullback/retest and the USD will fall at the same time?
Click here for yesterday’s market study
Conclusion
Here is our discretionary market outlook:
- The U.S. stock market’s long term risk:reward is no longer bullish. This doesn’t necessarily mean that the bull market is over. We’re merely talking about long term risk:reward. Long term risk:reward is more important than trying to predict exact tops and bottoms.
- The medium term direction (i.e. next 3-6 months) is neutral. Some market studies are medium term bullish while others are medium term bearish
- The stock market’s short term has a bearish lean due to the large probability of a pullback/retest. Focus on the medium-long term (and especially the long term) because the short term is extremely hard to predict.
A simple trading model that yields 13.2% per year has turned long term bearish for the first time since 2009.
Goldman Sachs’ Bull/Bear Indicator demonstrates that while the bull market’s top isn’t necessarily in, risk:reward does favor long term bears.
Our discretionary outlook is not a reflection of how we’re trading the markets right now. We trade based on our quantitative trading models.
Members can see exactly how we’re trading the U.S. stock market right now based on our trading models.
Click here for more market studies
By Troy Bombardia
I’m Troy Bombardia, the author behind BullMarkets.co. I used to run a hedge fund, but closed it due to a major health scare. I am now enjoying life and simply investing/trading my own account. I focus on long term performance and ignore short term performance.
Copyright 2019 © Troy Bombardia - All Rights Reserved
Disclaimer: The above is a matter of opinion provided for general information purposes only and is not intended as investment advice. Information and analysis above are derived from sources and utilising methods believed to be reliable, but we cannot accept responsibility for any losses you may incur as a result of this analysis. Individuals should consult with their personal financial advisors.
© 2005-2022 http://www.MarketOracle.co.uk - The Market Oracle is a FREE Daily Financial Markets Analysis & Forecasting online publication.