


The Macro Economy is Weakening. What this Means for Stocks
Stock-Markets / Stock Markets 2019 Jan 31, 2019 - 10:33 AM GMTBy: Troy_Bombardia

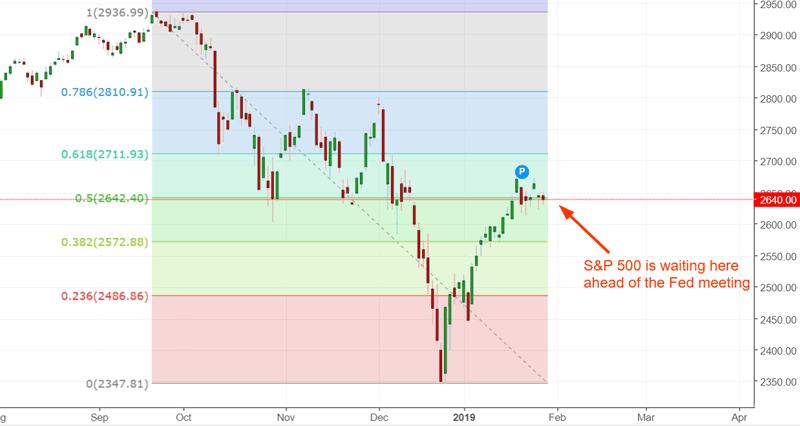
Not much has changed with the S&P 500 hovering around its 50% retracement. We will have a flood of macro data over the next few weeks to digest now that the government shutdown is over. This is very important when it comes to understanding whether or not this bull market will have 1 last leg up or not.
Go here to understand our fundamentals-driven long term outlook.
Let’s determine the stock market’s most probable medium term direction by objectively quantifying technical analysis. For reference, here’s the random probability of the U.S. stock market going up on any given day.

*Probability ≠ certainty. Past performance ≠ future performance. But if you don’t use the past as a guide, you are blindly “guessing” the future.
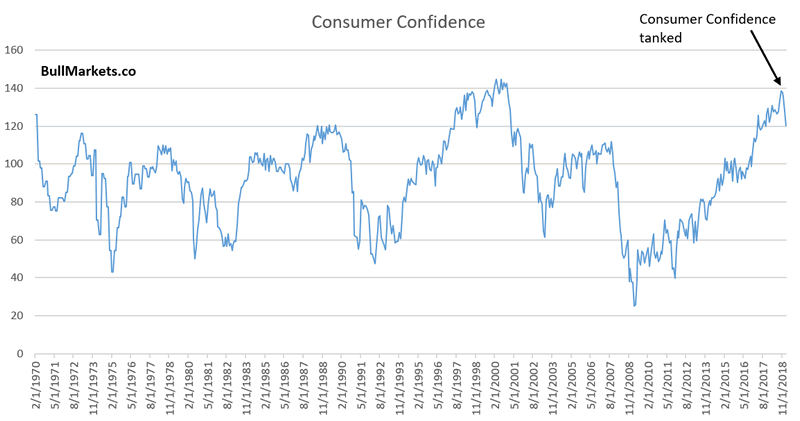
Macro deterioration: Consumer Confidence
Consumer Confidence has fallen significantly over the past 4 months. This is not good for the economy and stocks, especially considering that Consumer Confidence was very high in 2018 (economy was “as good as it gets”).
Here’s what happens next to the S&P 500 when Consumer Confidence falls by more than -18 over the past 4 months, while still above 100 (i.e. late-cycle)
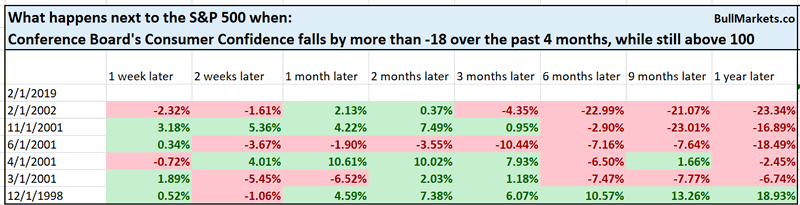
As you can see, the only similar cases were:
- 2001
- 1998
- *I ommitted 1970 because this data series only started in 1970. We have no idea what the data was like in 1969, 1968, etc. But remember: the stock market also tanked in 1970 and the economy was in a recession.
This lays out the framework:
- The bull market had 1 more year left after 1998. This is the most optimistic scenario
- The bull market was already over by early-2001
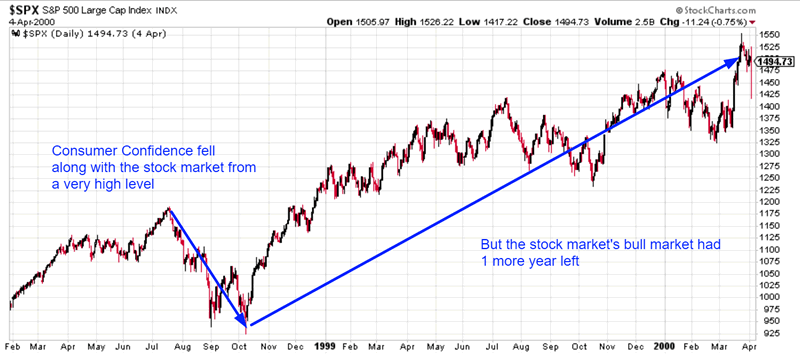
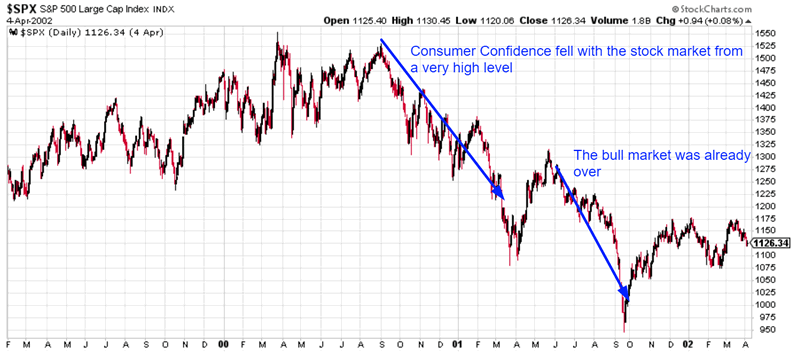
Either way, this is a late-cycle sign. The only question is whether this is like 1998 or 2001
Macro deterioration: ECRI
ECRI publishes a Weekly Leading Index for the economy. The year-over-year growth in the Weekly Leading Index has remained significantly negative for a while.
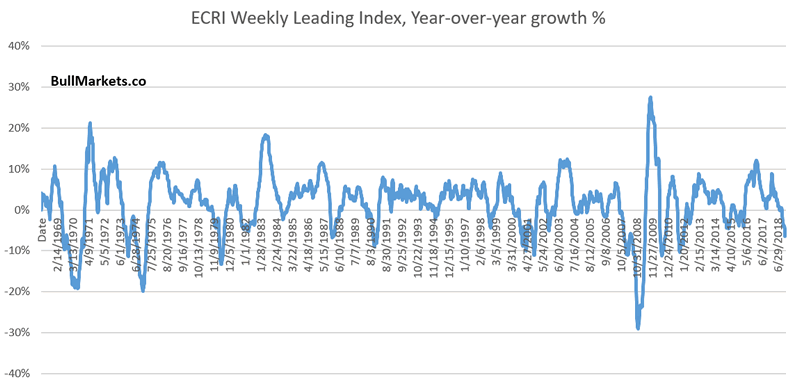
Here’s what happens next to the S&P 500 when the ECRI Weekly Leading Index’s year-over-year % change is under 5% for 4 consecutive weeks
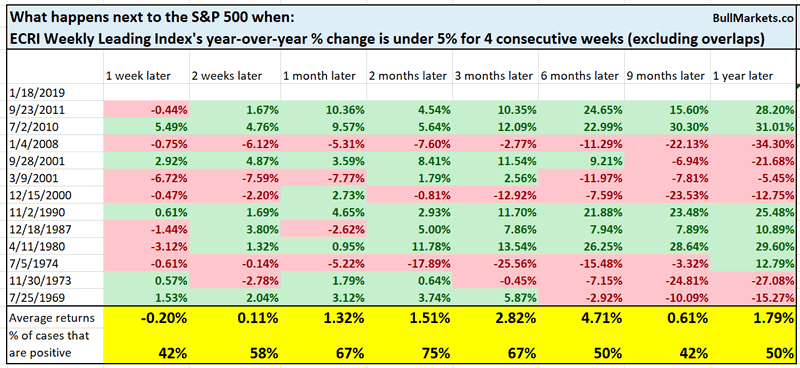
As you can see, the stock market’s long term forward returns are worse than random.
Macro Context
Crazy rally
The S&P 500 has rallied vigorously without any meaningful pullback over the past month. So when’s the pullback coming? (Most traders are looking for a pullback by now).
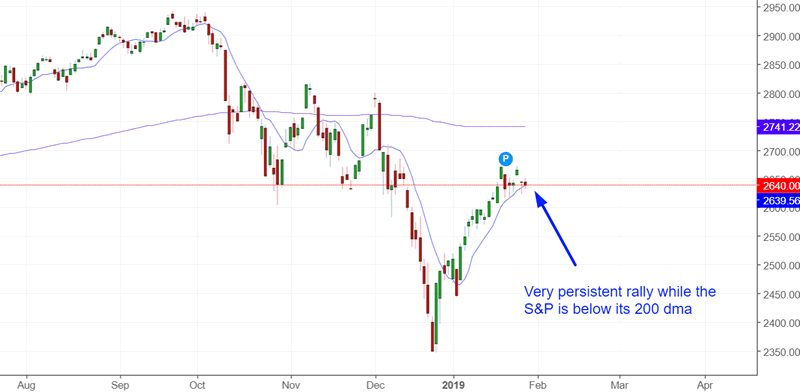
Here’s what happens next to the S&P when it is above its 10 day moving average for 17 consecutive days (steady rally), while under its 200 dma

As you can see, the S&P 500’s forward returns over the next 2 weeks lean bearish.
Macro Context
Price action
Some traders like to use “price action” for trading the S&P 500 (how price responds to support/resistance).
The S&P has remained above its 50 dma for 8 consecutive days. This is the first sustained breakout since September 2018. Is this a sign of “bullish price action”?
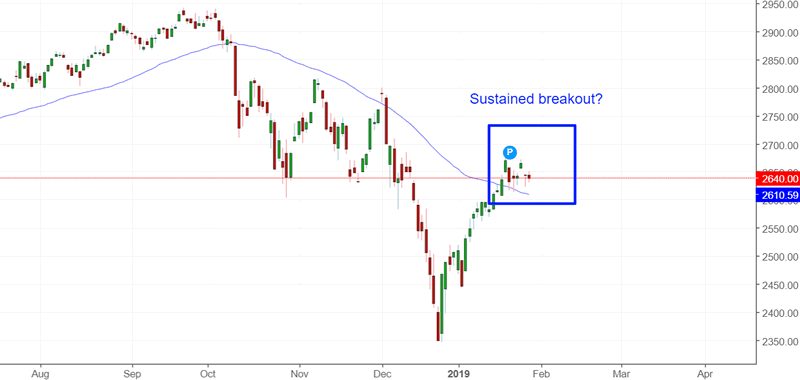
Here’s what happens next to the S&P when the S&P is above its 50 dma for 8 consecutive days, while under its 200 dma
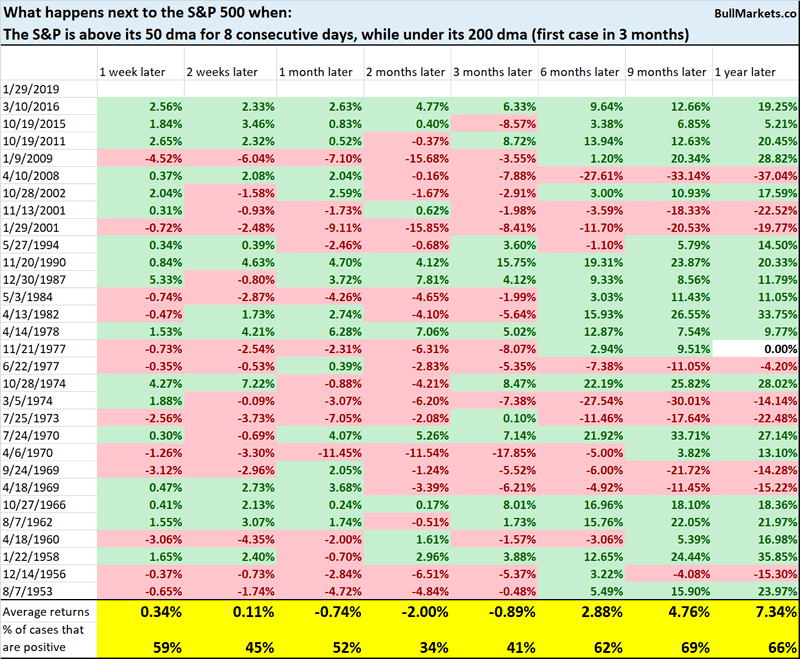
As you can see, the stock market’s 2 month forward returns lean bearish. A lot of the “first sustained breakouts” eventually fail.
Macro Context
Fed meeting
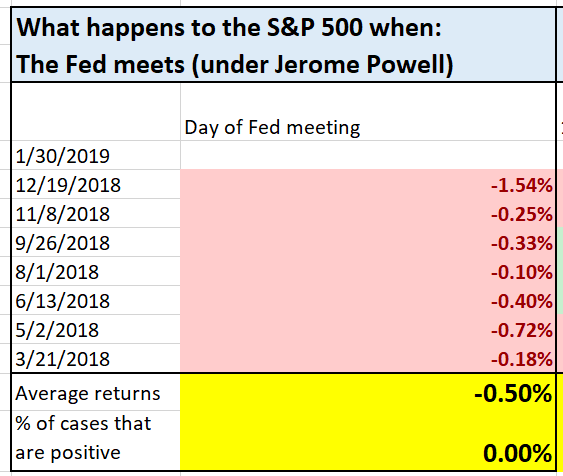
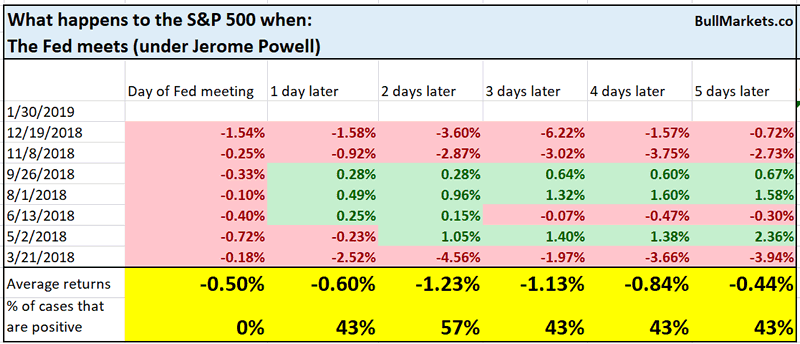
Tomorrow concludes the Federal Reserve’s meeting. Perhaps the Fed’s meeting will trigger a pullback/retest. (Who knows. Trying to guess and time short term movements is very hard, which is why we focus on the medium-long term).
So far, Fed meeting days under chair Jerome Powell have not been good for the stock market
Click here for yesterday’s market study
Conclusion
Here is our discretionary market outlook:
- The U.S. stock market’s long term risk:reward is no longer bullish. This doesn’t necessarily mean that the bull market is over. We’re merely talking about long term risk:reward. Long term risk:reward is more important than trying to predict exact tops and bottoms.
- The medium term direction (i.e. next 3-6 months) is neutral. Some market studies are medium term bullish while others are medium term bearish
- The stock market’s short term has a bearish lean due to the large probability of a pullback/retest. Focus on the medium-long term (and especially the long term) because the short term is extremely hard to predict.
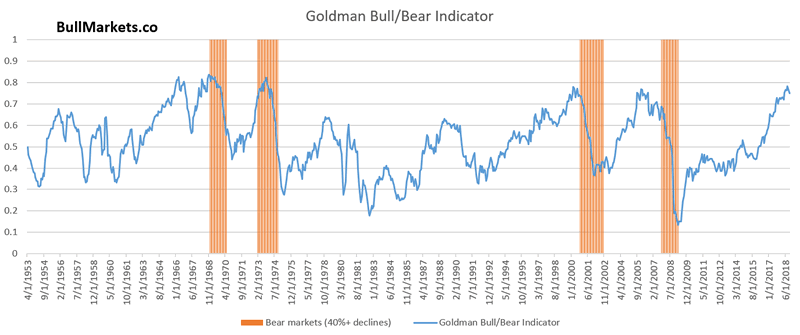
Goldman Sachs’ Bull/Bear Indicator demonstrates that while the bull market’s top isn’t necessarily in, risk:reward does favor long term bears.
Our discretionary outlook is not a reflection of how we’re trading the markets right now. We trade based on our clear, quantitative trading models, such as the Medium-Long Term Model.
Members can see exactly how we’re trading the U.S. stock market right now based on our trading models.
Click here for more market studies
By Troy Bombardia
I’m Troy Bombardia, the author behind BullMarkets.co. I used to run a hedge fund, but closed it due to a major health scare. I am now enjoying life and simply investing/trading my own account. I focus on long term performance and ignore short term performance.
Copyright 2019 © Troy Bombardia - All Rights Reserved
Disclaimer: The above is a matter of opinion provided for general information purposes only and is not intended as investment advice. Information and analysis above are derived from sources and utilising methods believed to be reliable, but we cannot accept responsibility for any losses you may incur as a result of this analysis. Individuals should consult with their personal financial advisors.
© 2005-2022 http://www.MarketOracle.co.uk - The Market Oracle is a FREE Daily Financial Markets Analysis & Forecasting online publication.