


Corporate Earnings Growth is Falling and Turning Negative. What this Means for Stocks
Stock-Markets / Corporate Earnings Feb 07, 2019 - 10:45 AM GMTBy: Troy_Bombardia

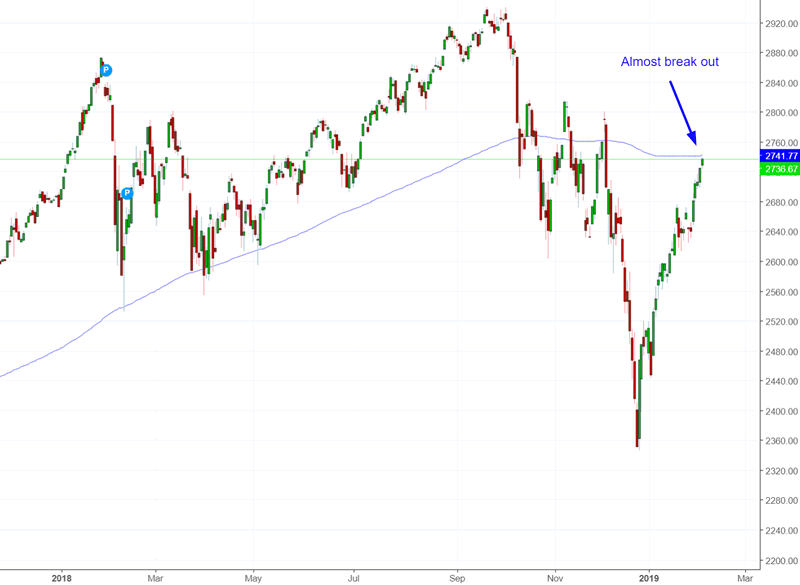
As the stock market rallies higher and is on the verge of breaking out above its 200 day moving average, the outlook for Q1 2019 corporate earnings growth is falling. Is this bad news for the stock market?
Go here to understand our fundamentals-driven long term outlook.
Let’s determine the stock market’s most probable medium term direction by objectively quantifying technical analysis. For reference, here’s the random probability of the U.S. stock market going up on any given day.

*Probability ≠ certainty. Past performance ≠ future performance. But if you don’t use the past as a guide, you are blindly “guessing” the future.
Falling earnings growth
Wall Street’s expectations for Q1 2019 earnings growth has been falling, and is now negative.
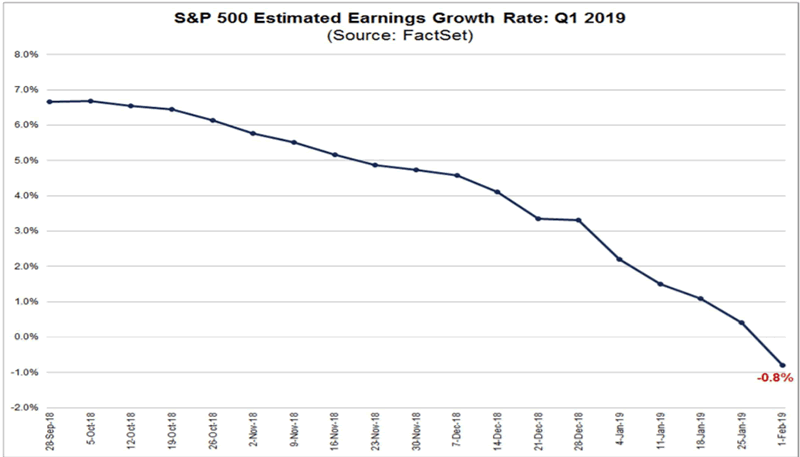
This is a very rapid decline in corporate earnings. Earnings growth exceeded 20% even in Q3 2018.
*Much of this decline is due to tougher comparisons. Earnings surged in 2018 partially due to the Trump tax cut, which resulted in a 1 time boost to corporate earnings growth. Now that 1 year has passed since the tax cut, earnings growth is falling.
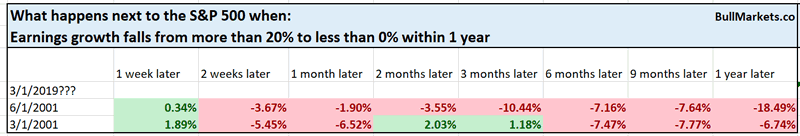
From 1990 – present, there has only been 1 other case in which earnings growth fell from more than 20% to less than 0% within 1 year.
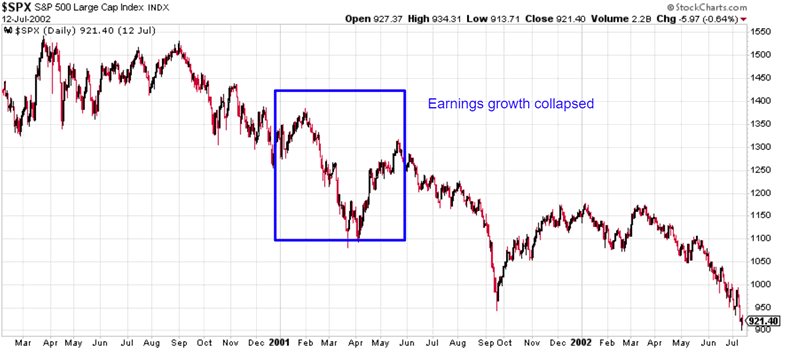
Here’s a chart for the S&P in Q1 and Q2 2001, as the 2000-2002 bear market was getting started and dot-com profits evaporated.
n =2, so take this “long term bearish sign” with a grain of salt. But at the very least, this isn’t a bulish factor for stocks.
Breakout
The S&P is extremely close to breaking out above its 200 day moving average, which means that many trend following strategies are also close to turning bullish. This comes after the stock market is extremely oversold.
Such breakouts usually result in more gains for the stock market over the next 3-12 months. Traders and investors who sold into the crash are encouraged by the breakout to jump back into stocks. As they chase the stock market higher and “buy the dip”, the rally continues.
Here’s what happens next to the S&P 500 when the S&P closes above its 200 dma, after being more than -14% below its 200 dma over the past 3 months.
*Data from 1950-present
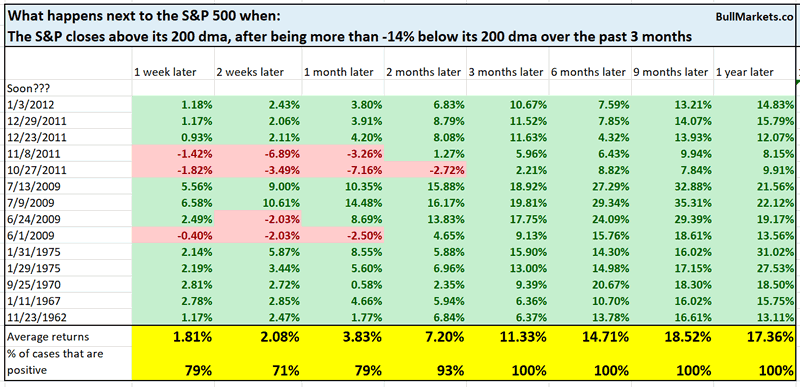
As you can see, this is a consistently bullish factor for stocks 3-12 months later. Some of the cases are overlaps, but they cluster around:
- Late-2011
- mid-2009
- early-1975
- late-1970
- early 1967
- late 1962
This happens a lot after massive stock market crashes.
Not just the S&P 500
Yesterday I said that the S&P has made a V-shaped recovery, and that this typically leads to a pullback/retest
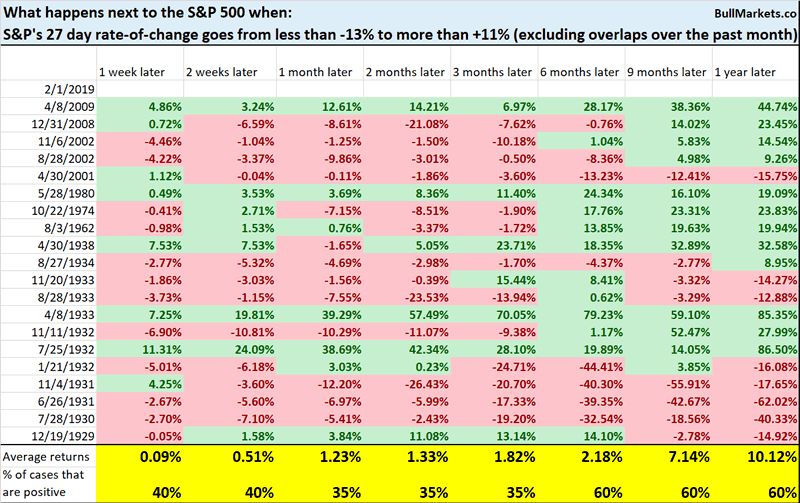
It’s not just the S&P that has made a V-shaped rally. Other indices have as well.
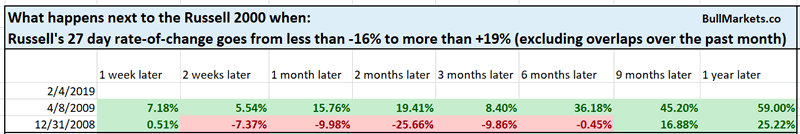
For example, the Russell 2000’s (small caps index) 27 day rate-of-change has gone from less than -16% to more than +19%
From 1987 – present, this has only happened 2 other times.
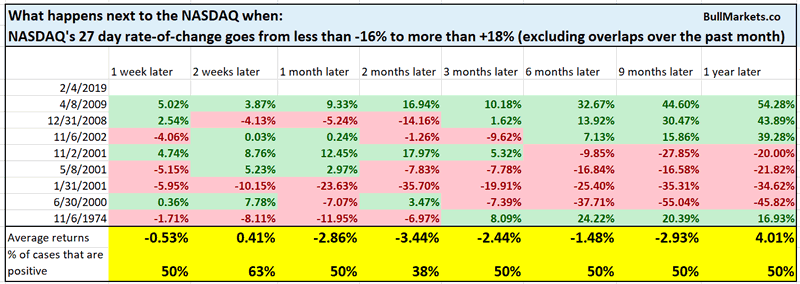
The NASDAQ’s 27 day rate-of-change has gone from less than -16% to more than +18%.
From 1971 – present, this has usually led to NASDAQ weakness over the next 2 months.
Volatility of volatility
The volatility of volatility has gotten some attention recently, with some traders looking to short stocks and long volatility.
$VVIX (VIX of VIX) has become quite low.
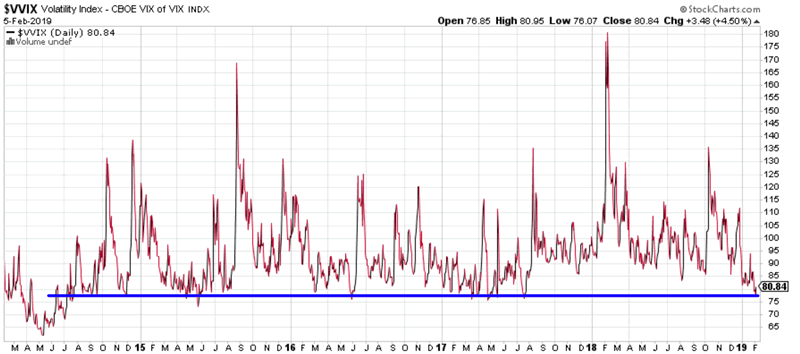
Is this a bearish sign for stocks and bullish sign for VIX?
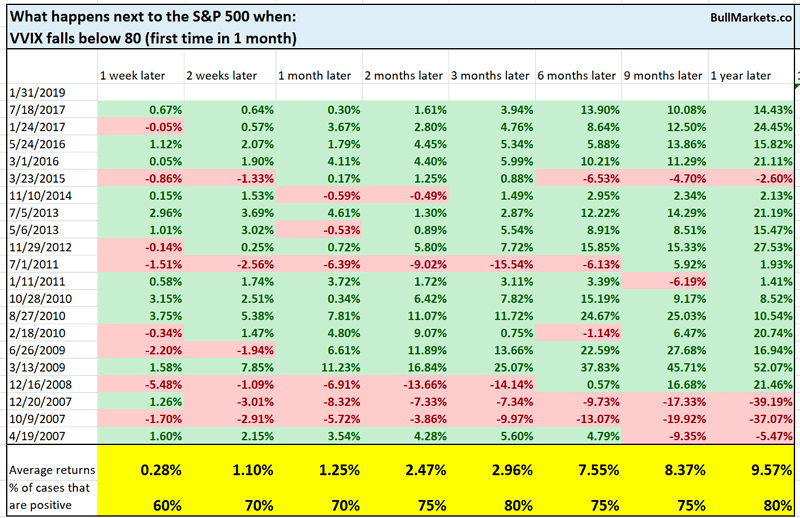
Here’s what happens next to the S&P 500 when VVIX falls below 80
Here’s what happens next to VIX when VVIX falls below 80
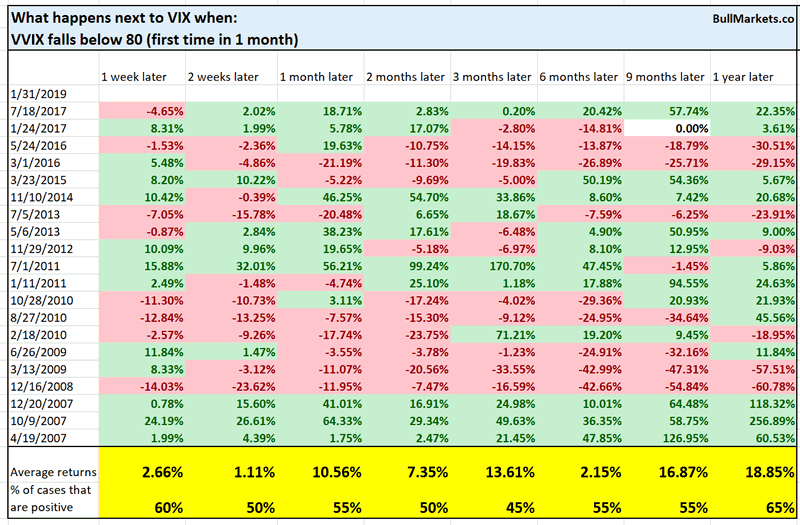
As you can see, this is neither consistently bullish nor bearish for the S&P and VIX.
Meanwhile, VIX’s 14 day RSI has become quite low.
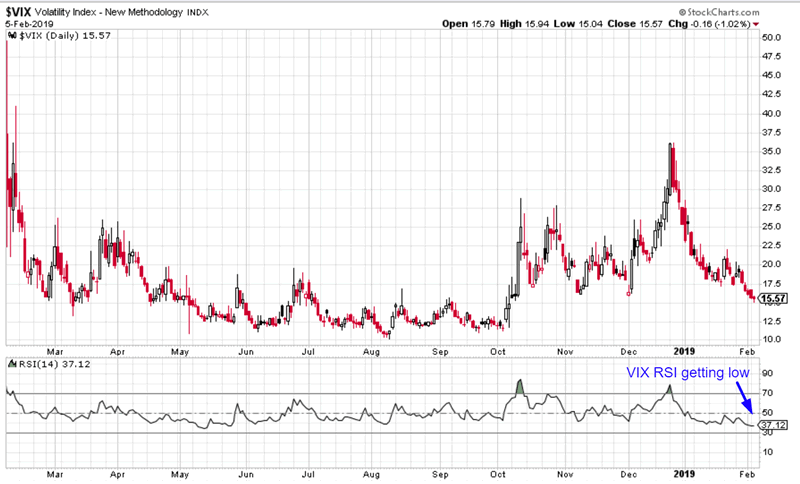
Is this a bearish sign for stocks and bullish sign for VIX?
Here’s what happens next to the S&P when VIX’s 14 day RSI falls below 38
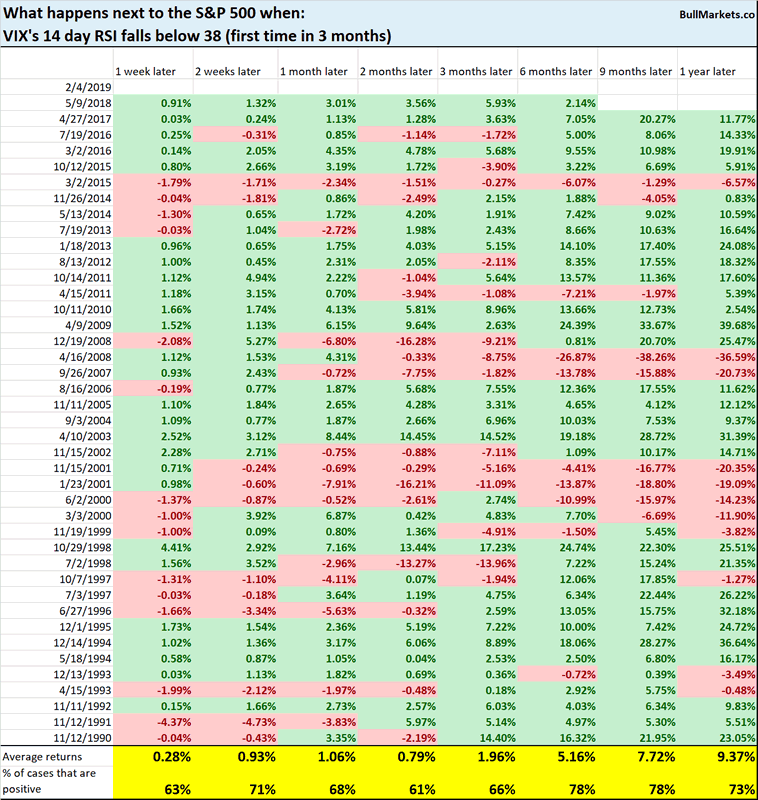
Here’s what happens next to VIX when VIX’s 14 day RSI falls below 38
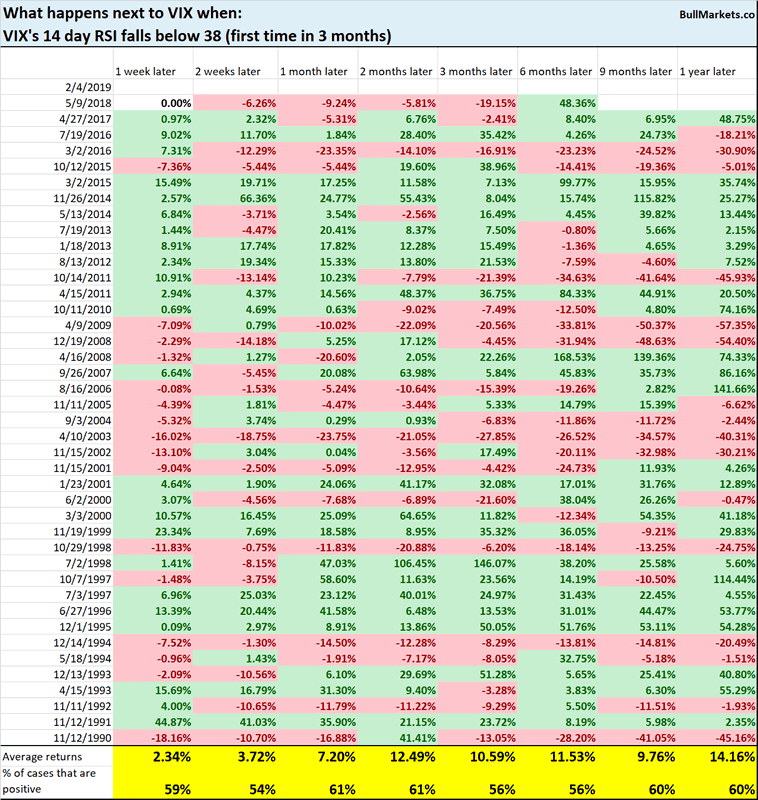
Once again, this is neither consistently bullish nor bearish for the S&P and VIX.
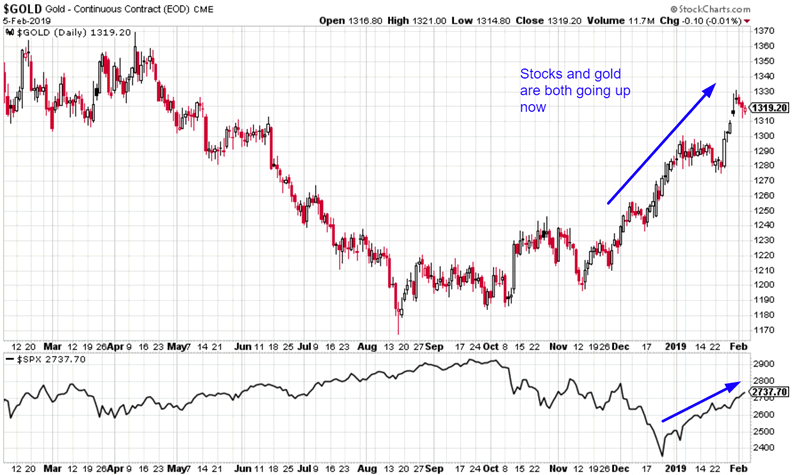
Gold
Gold initially went up in Q4 2018 as a safety haven play. Stocks were falling, and gold went up.
But now, gold and the S&P are trending higher together. One would assume that after the stock market crash ended, gold’s rally would stop.
Here’s what happens next to the S&P when gold goes up more than 4% over the past 30 days while the S&P goes up more than 10%
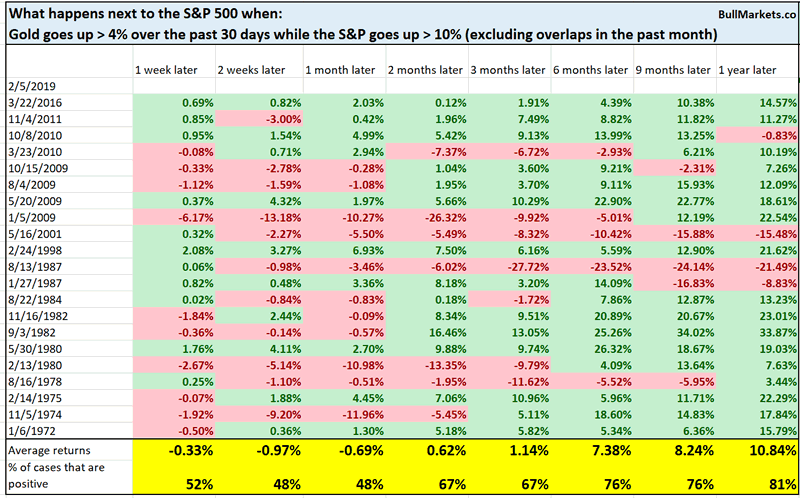
This is mostly random for stocks, although there is a slight bearish lean over the next 2-4 weeks.
Here’s what happens next to gold
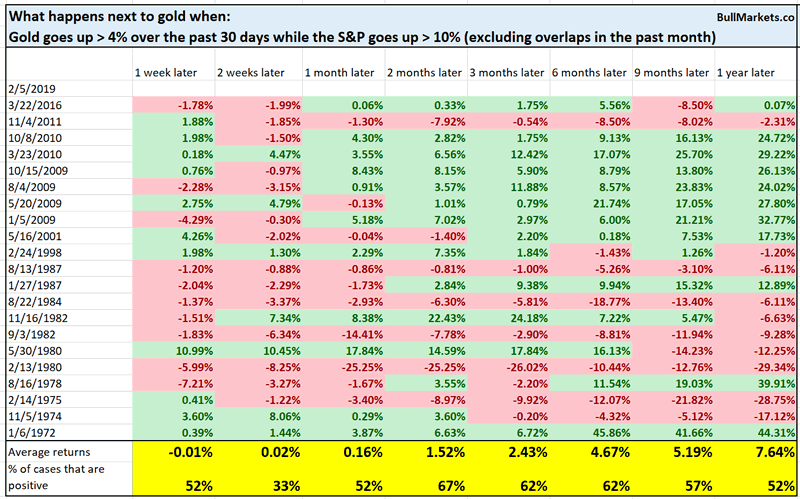
This has a bearish lean for gold over the next 2 weeks, after which this is neither consistently bullish nor bearish for gold
Click here for yesterday’s market study
Conclusion
Here is our discretionary market outlook:
- The U.S. stock market’s long term risk:reward is no longer bullish. This doesn’t necessarily mean that the bull market is over. We’re merely talking about long term risk:reward. Long term risk:reward is more important than trying to predict exact tops and bottoms.
- The medium term direction (i.e. next 3-6 months) is neutral. Some market studies are medium term bullish while others are medium term bearish
- The stock market’s short term has a bearish lean due to the large probability of a pullback/retest. Focus on the medium-long term (and especially the long term) because the short term is extremely hard to predict.
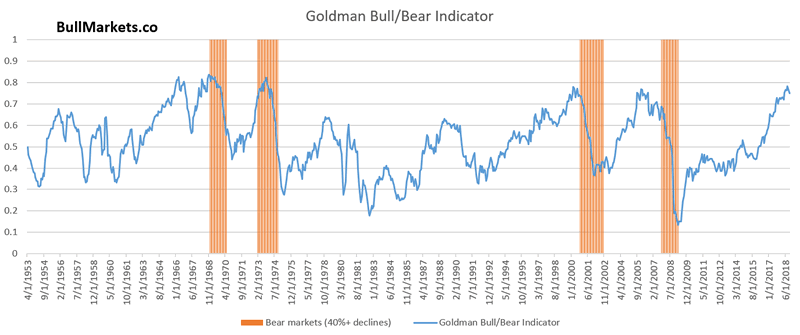
Goldman Sachs’ Bull/Bear Indicator demonstrates that while the bull market’s top isn’t necessarily in, risk:reward does favor long term bears.
Our discretionary outlook is not a reflection of how we’re trading the markets right now. We trade based on our clear, quantitative trading models, such as the Medium-Long Term Model.
Members can see exactly how we’re trading the U.S. stock market right now based on our trading models.
Click here for more market studies
By Troy Bombardia
I’m Troy Bombardia, the author behind BullMarkets.co. I used to run a hedge fund, but closed it due to a major health scare. I am now enjoying life and simply investing/trading my own account. I focus on long term performance and ignore short term performance.
Copyright 2019 © Troy Bombardia - All Rights Reserved
Disclaimer: The above is a matter of opinion provided for general information purposes only and is not intended as investment advice. Information and analysis above are derived from sources and utilising methods believed to be reliable, but we cannot accept responsibility for any losses you may incur as a result of this analysis. Individuals should consult with their personal financial advisors.
© 2005-2022 http://www.MarketOracle.co.uk - The Market Oracle is a FREE Daily Financial Markets Analysis & Forecasting online publication.