


3 Charts That Scream “Don’t Buy Stocks”
Stock-Markets / Stock Markets 2019 Feb 14, 2019 - 04:30 PM GMTBy: John_Mauldin

 In World War II, Nobel laureate Ken Arrow was assigned a team of statisticians to make long-range weather forecasts.
These people were some of the biggest math geniuses on the planet.
And yet, Arrow and his team soon realized that their forecasts were no better than a blind guess.
Seeing no value in their models, the team asked to be relieved of the duty.
The superiors replied: “The Commanding General is well aware that the forecasts are no good. However, he needs them for planning purposes.”
This story holds an important lesson about investing.
None of us know the future. We can make reasonable forecasts, but they’re always uncertain.
But here’s the important point. We need context with which to greet the uncertain future.
That’s why Eisenhower, Nixon, and so many others have said that planning is essential, even if we don’t know the future.
I recently wrote that the next decade will be profoundly and deeply different than the past, and we will get different results than most people expect.
That raises the question, different in what ways? What are these expectations I think will prove wrong?
In this article, I’ll look at the models that could give us a glimpse into the next decade. They may be not accurate. They will be useful, though.
Starting Valuation Matters
I’m fairly confident that the next 10 years will bring increased volatility and an eventual bear market. I can’t rule out a shorter-term market melt-up before the meltdown, though.
Bull markets end when optimism peaks. At that point, everyone who is going to buy into the market has done so. Then prices have nowhere to go but down.
Now, what could cause a market melt-up today?
What if Trump announces a resolution with China and May in the UK announces a successful Brexit deal? Combined with recent Fed dovishness, this could quickly turn a relief rally into a melt-up.
Of course, if all those circumstances turn negative, you could see the opposite.
As Benjamin Graham taught us, in the short run, markets are a voting machine; in the long run, they are a weighing machine.
The short-run voting machine is just another way to talk about optimism. And the good news is that we have a way to measure optimism.
Earnings multiples tell us what people are actually willing to pay for the expectation of future profits. High P/E ratios signal confidence. Very high P/E ratios signal overconfidence.
The below chart is from Ed Easterling of Crestmont Research. (I really pay attention to his important and useful research. You should, too.)
Ed looked at market valuations of long periods and compared them to subsequent returns. The correlation is pretty tight.
When you buy into the market at above-average P/E ratios (orange line), the next decade brings below-average returns (green bar)—assuming you buy and hold the entire period.
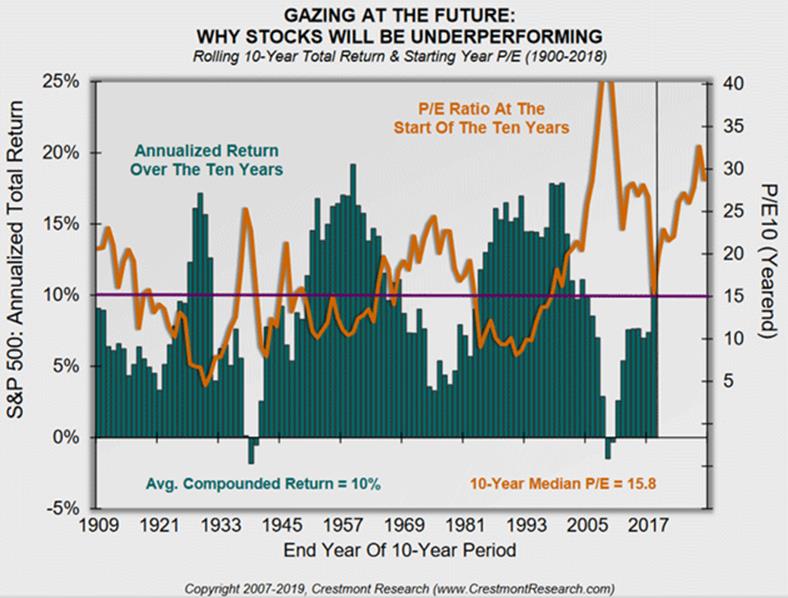
Source: Crestmont Research.
This should not come as a surprise.
Starting valuation matters. If you overpay you will likely underperform. And if you bought into stocks prior to December, you probably overpaid.
The time to buy is when blood is running in the streets. And that’s not now, despite last quarter’s volatility.
High Risk, Low Returns
You can look at this in other ways, too.
Rob Arnott’s team at Research Affiliates don’t extrapolate past returns. Instead, they calculate expected returns based on expected cash flows and changes in asset prices.
Research Affiliates further calculates expected volatility, which lets them produce the classic risk-reward scatterplot below.
The vertical axis is expected return; the horizontal axis is expected volatility.
The ideal investment (high return, low volatility) would be in the upper left quadrant. Sadly, the area is blank.
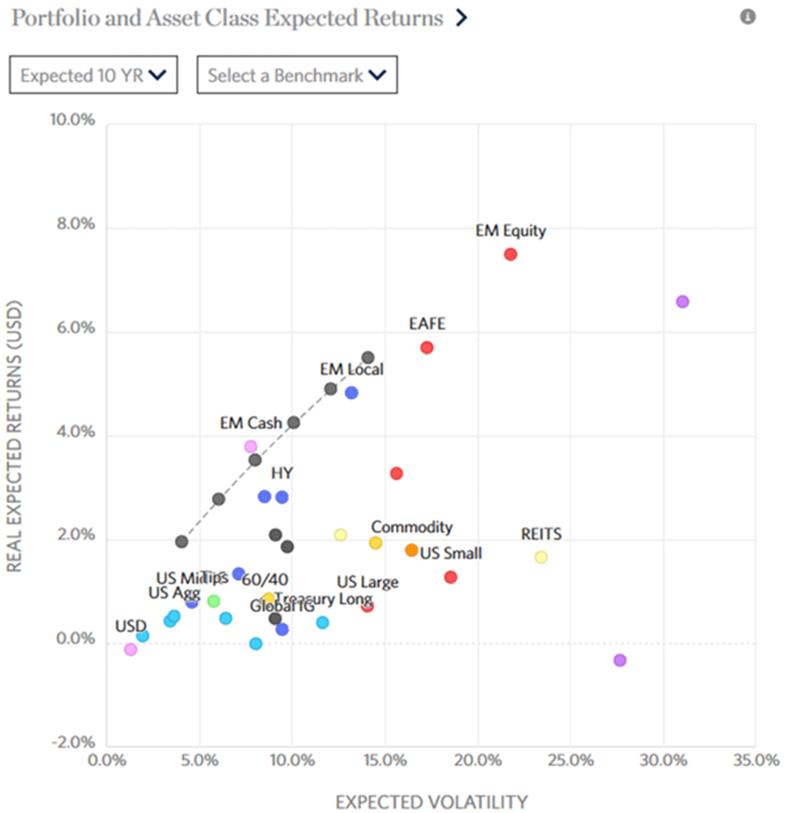
Source: Research Affiliates
Instead, we see a lot of asset classes clustered in the lower left. This indicates low returns and low volatility.
Rob’s forecast is pretty bleak if you want more than about 4% returns over the next decade. Some major pension plans assume 7% returns or more. They will be in serious trouble if this comes true.
You can view more details and play with different scenarios using the interactive version of this chart.
For a geek like me, I fond the interactive version very instructive, entertaining, and fun. Good luck finding better news, though.
Low Unemployment Precedes Recession
This next chart needs a little explaining.
It comes from Ned Davis Research via my friend and business partner Steve Blumenthal. It turns out there is significant correlation between the unemployment rate and stock returns—but not the way you might expect.
Logically, you would think low unemployment means a strong economy and thus a strong stock market. In fact, the opposite is true.
Going back to 1948, the US unemployment rate was below 4.3% for 20.5% of the time. In those years, the S&P 500 gained an annualized 1.7%.
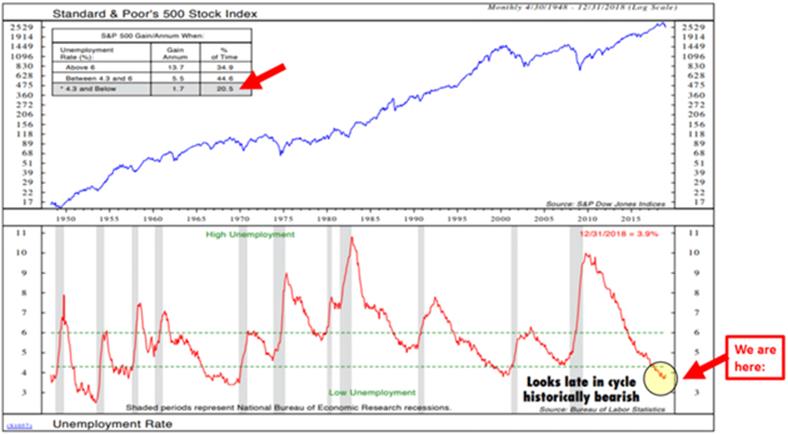
Source: Ned Davis Research
Now, 1.7% is meagre but still positive. It could be worse. But why is it not stronger?
I think because unemployment is lowest when the economy is in a mature growth cycle. In those periods, stock returns tend to start flattening and rolling over.
Sadly, that is where we seem to be right now. Unemployment is presently in the “low” range which often preceded recession in the past.
It is certainly possible this time will be different in a good way. Maybe we can sustain low unemployment this late in a cycle and still see stocks deliver good returns.
I wouldn’t rule it out. But I wouldn’t expect it, either.
The time to buy is when fear—and the unemployment rate—is at its highest, not its lowest. That’s not the case now.
Choose Data Wisely
Be aware of the data you use. Which assumptions you make, and which models you select will have a big influence on your plans.
Let me give you one obvious example to wrap this up.
Many financial advisors use a simple long-term average of the stock market to create retirement plans. They often assume a 7% or 8% growth in the equity portion of a portfolio—both before and after retirement.
If your investment and retirement plans assume such results, I suggest you reconsider. Maybe find a financial planner or software program with a bit more sophistication.
Join hundreds of thousands of other readers of Thoughts from the Frontline
Sharp macroeconomic analysis, big market calls, and shrewd predictions are all in a week’s work for visionary thinker and acclaimed financial expert John Mauldin. Since 2001, investors have turned to his Thoughts from the Frontline to be informed about what’s really going on in the economy. Join hundreds of thousands of readers, and get it free in your inbox every week.
© 2005-2022 http://www.MarketOracle.co.uk - The Market Oracle is a FREE Daily Financial Markets Analysis & Forecasting online publication.