


After 8 Terrific Weeks for Stocks, What’s Next?
Stock-Markets / Stock Markets 2019 Feb 16, 2019 - 04:37 PM GMTBy: Troy_Bombardia

It’s been a terrific 8 weeks for the stock market. If anything, this proves that in the stock market, an objective investor/trader needs to have a long term bullish bias.
On the surface, this seems contradictory. How can you be “objective” and have a bullish “bias” at the same time?
Because the stock market goes up more often than it goes down. The stock market follows the economy in the long run. More often than not, the economy is expanding rather than contracting. Humanity is improving more often than it is deteriorating.
Go here to understand our fundamentals-driven long term outlook.
Let’s determine the stock market’s most probable medium term direction by objectively quantifying technical analysis. For reference, here’s the random probability of the U.S. stock market going up on any given day.

*Probability ≠ certainty. Past performance ≠ future performance. But if you don’t use the past as a guide, you are blindly “guessing” the future.
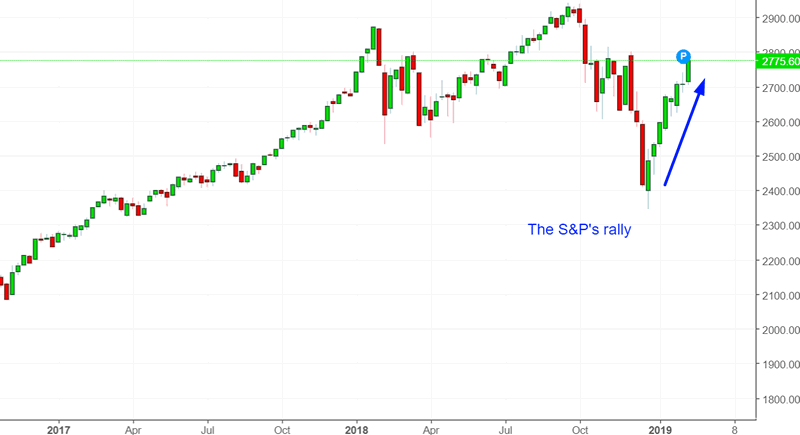
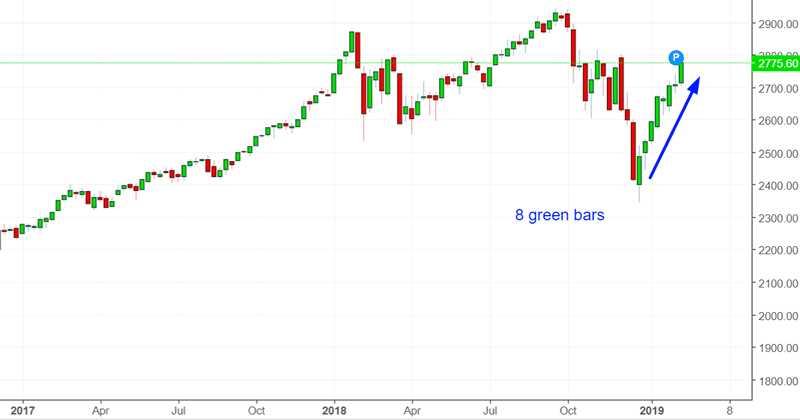
Terrific 8 weeks
The S&P has gone 8 consecutive weeks in which its weekly CLOSE was higher than its weekly OPEN
Here are similar cases for the S&P, and what it did next

As you can see, this is a slightly long term bullish factor for the S&P (1 year later). More often than not, such strong momentum carries forward into the year ahead.
This is the first time since 1987 in which the Russell 2000, NASDAQ, and S&P have all gone 8 weeks in a row in which their weekly CLOSES > their weekly OPENS
And lastly, there is only 1 other case (except right now) in which the S&P rallied 8 weeks in a row from a 1 year low:
April 1957
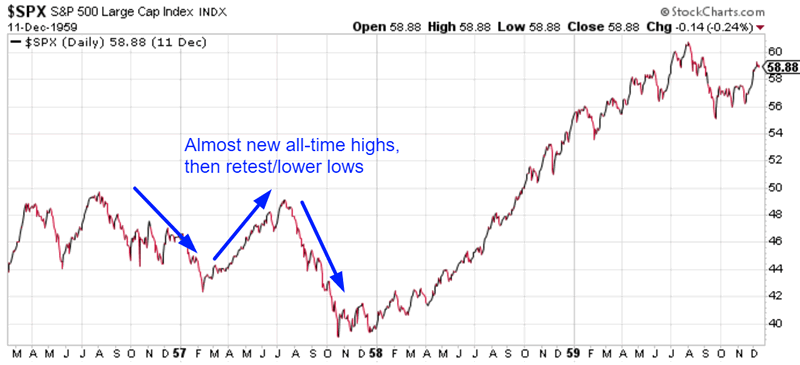
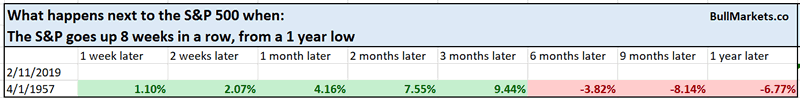
This is a case that I had outlined weeks ago. It is one of the few historical cases in which the S&P came close to making a new all-time high before making a pullback/retest.
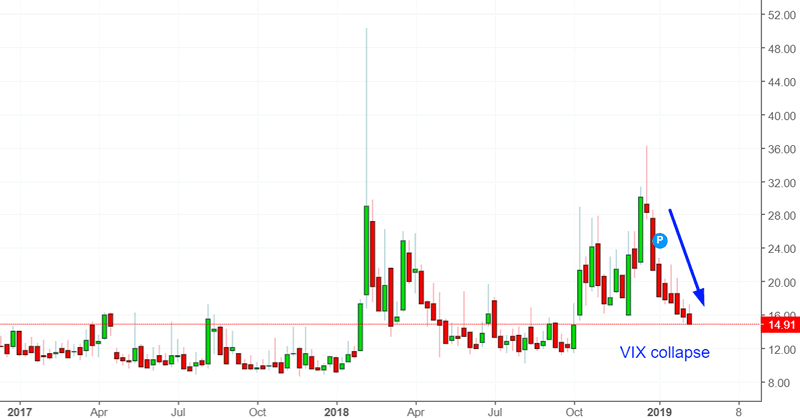
VIX
While the stock market has soared, VIX has collapsed. It is now down 8 weeks in a row.
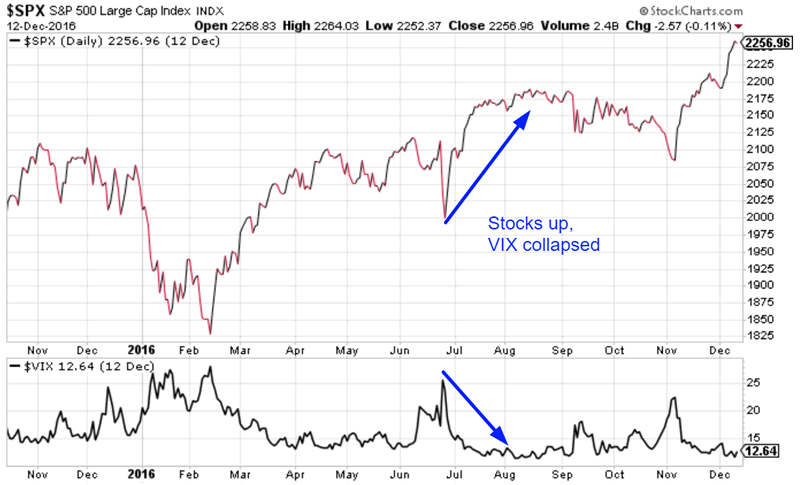
VIX has fallen more than -50% over the past 8 weeks, and this has only happened 1 other time since 1990:
August 15, 2016
But more importantly, VIX closed below 15 today for the first time in more than 4 months.
This is important, because VIX is typically more elevated in bear market rallies.
Here’s what happens next to the S&P when VIX closes under 15, for the first time in 4 months
*Data from 1990 – present
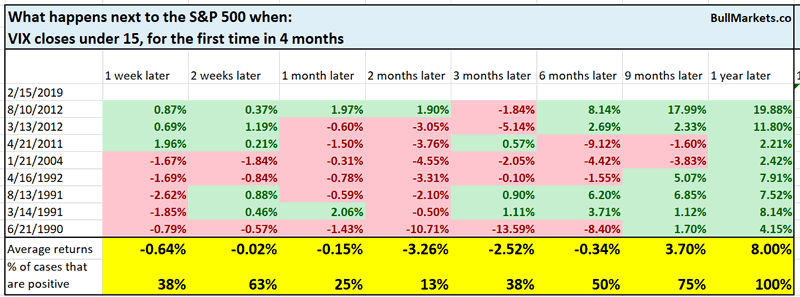
This is a short term bearish factor for the stock market (especially 2 months later), but is bullish for stocks over the next 1 year.
Here’s what happens next to VIX when VIX closes under 15, for the first time in 4 months
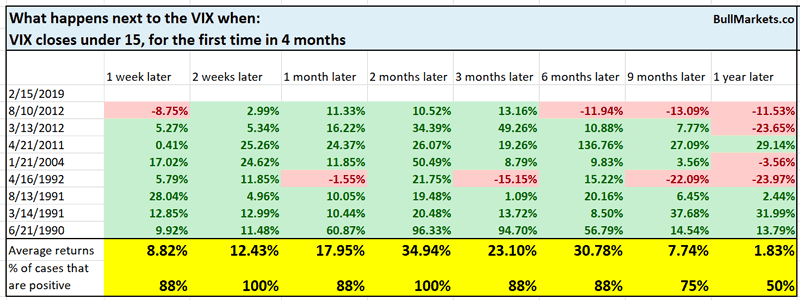
Perhaps it’s time to go long VIX?
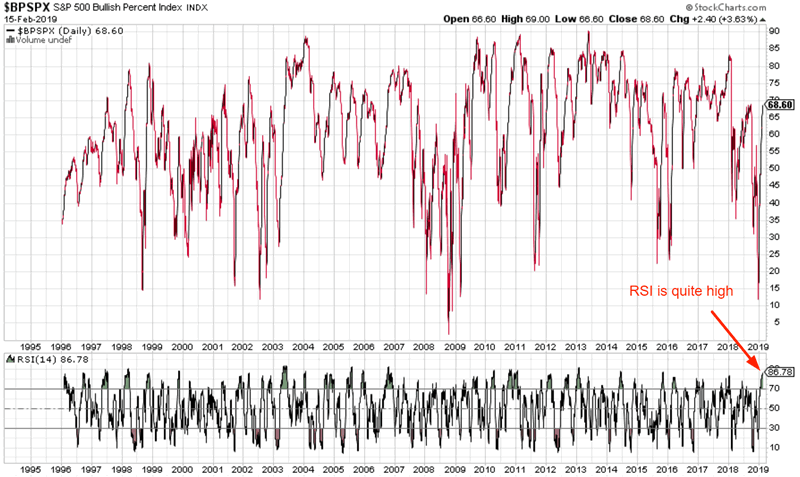
BPSPX
The S&P 500 Bullish Percent Index is another breadth indicator. (I’m not a huge fan of breadth indicators, but traders seem to love this stuff).
The S&P Bullish Percent Index’s 14 day RSI is very overbought right now. Is this bad news for the stock market?
Here’s what happens next to the S&P when the Bullish Percent Index’s 14 day RSI exceeds 86
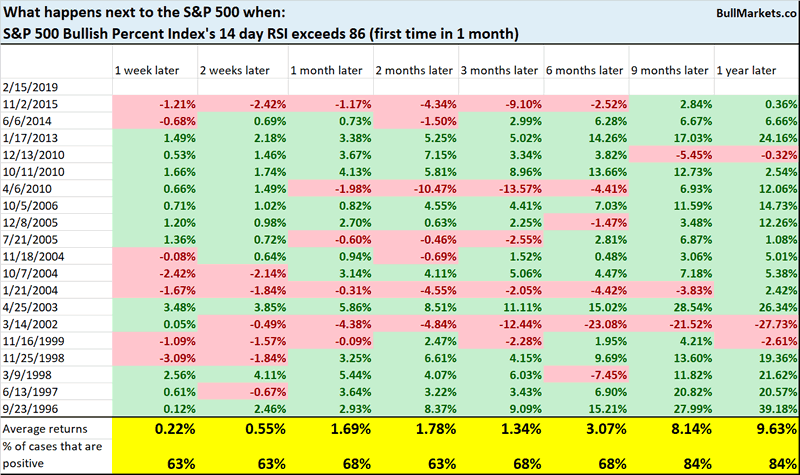
Not a consistently bearish sign for the stock market on any time frame, although there is a slight bullish lean 9-12 months later.
Breadth usually isn’t this strong in a bear market.
Great start to the year
It’s been a terrific start to the year, with the S&P gaining more than 10%.
This has some investors and financial commentators thinking that most of 2019’s gains are already over.
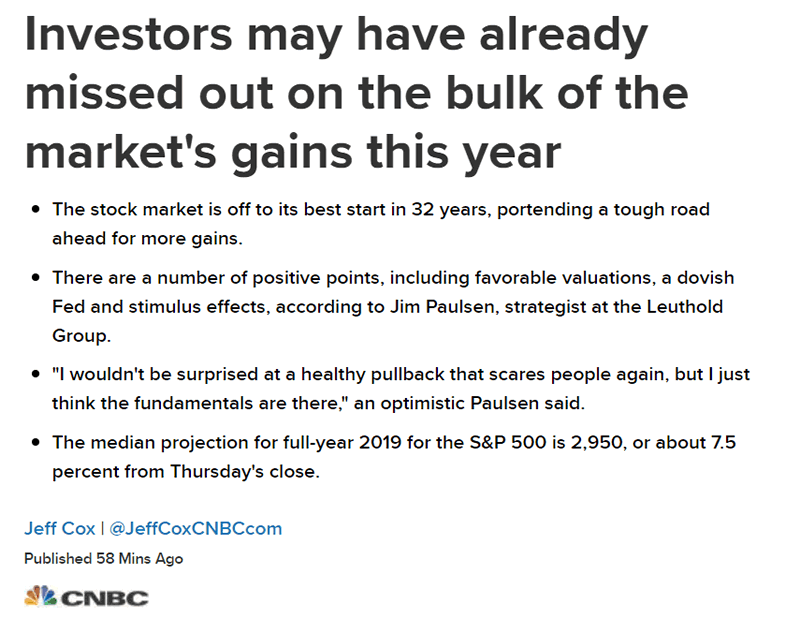
This isn’t always true.
Here’s what happens next to the S&P when it goes up more than 10% in January and February.
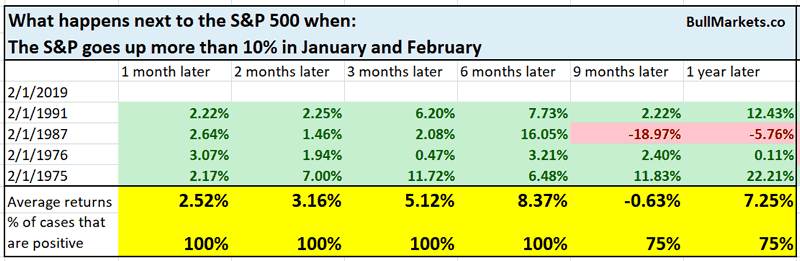
*February obviously isn’t over, so take this with a grain of salt.
Let’s loosen the study’s parameters a little.
Here’s what happens next to the S&P when it goes up more than 8% in January and February.
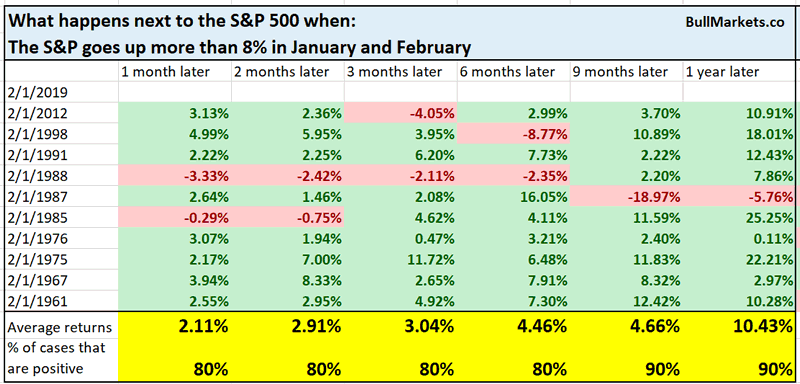
As you can see, there’s no reason why 2019’s gains MUST be mostly over. Strength can beget more strength. (That’s the idea behind “momentum”, a well researched factor in investing since the 1990s).
Gold
I find gold’s recent rally to be quite remarkable:
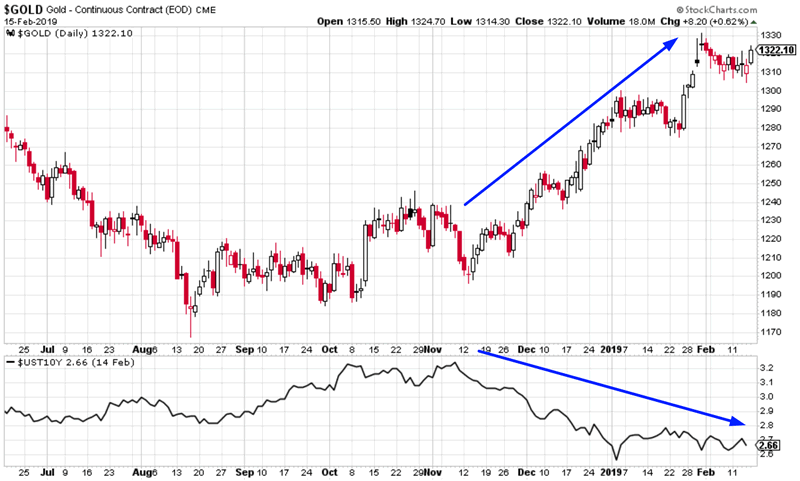
- Gold is rallying while interest rates are falling.
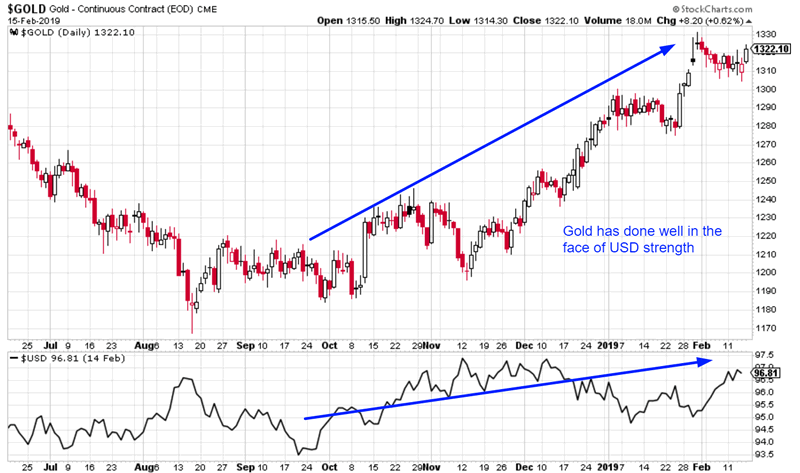
- Gold is rallying while the U.S. Dollar is doing well.
Gold and yields both respond to inflation. That’s why more often than not, major rallies in gold are accompanied by rising interest rates. (Both gold and interest rates soared in the 1970s).
On the other hand, gold and the U.S. Dollar Index usually have an inverse correlation.
Here’s a chart demonstrating that gold has gone up while rates have gone down.
Here’s a chart demonstrating that gold has done well in the face of a strong USD.
Here’s what happens next to gold when gold goes up more than 10% over the past 3 months, while the % change in the 10 year yield is less than -15% (first case in 1 month)
* Data from 1970 – present
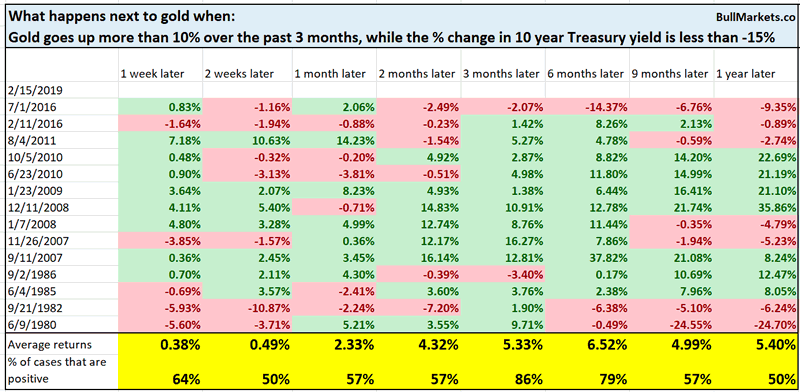
This is quite bullish for gold 3 months later
Here’s what the 10 year Treasury yield does next
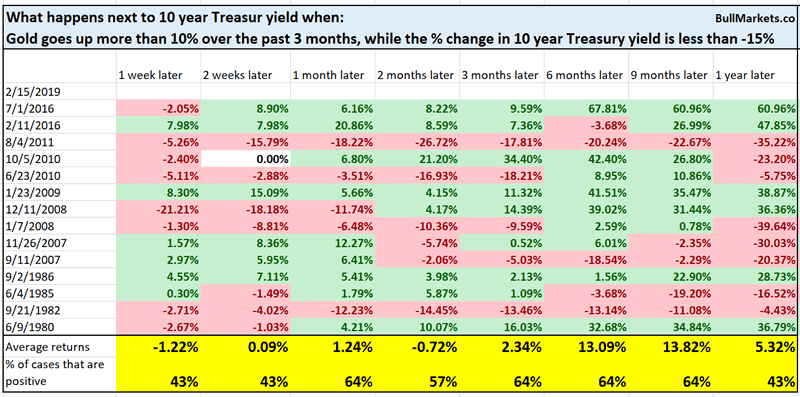
Not consistently bullish or bearish.
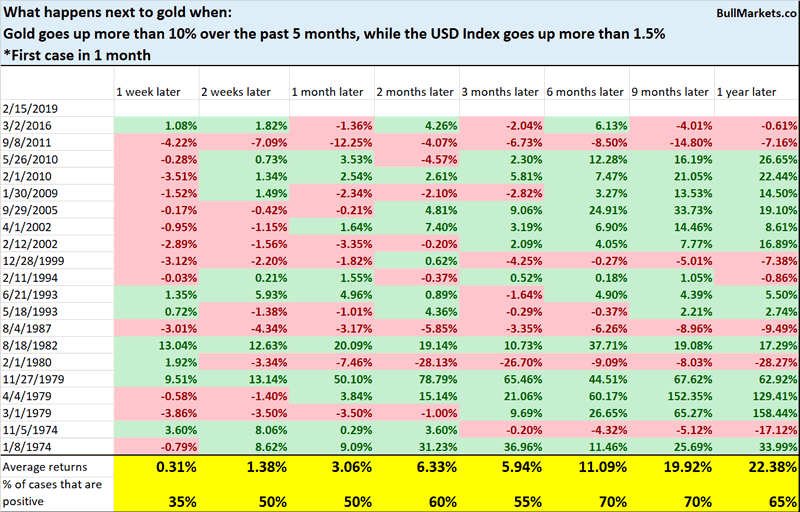
Here’s what happens next to gold when gold goes up more than 10% over the past 3 months, while the USD Index goes up more than 1.5%
*Data from 1973-present
Here’s what happens next to the USD
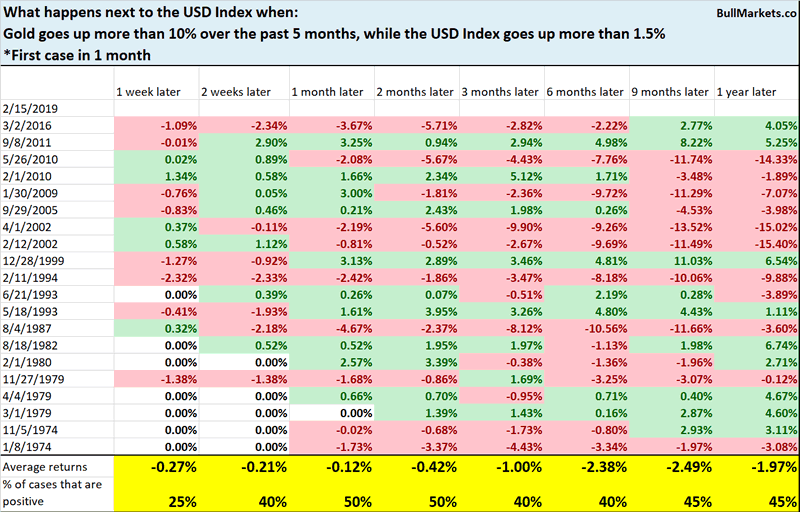
Not consistently bullish or bearish for gold or the USD Index
Click here for yesterday’s market study
Conclusion
Here is our discretionary market outlook:
- The U.S. stock market’s long term risk:reward is no longer bullish. In a most optimstic scenario, the bull market probably has 1 year left. Long term risk:reward is more important than trying to predict exact tops and bottoms.
- The medium term direction (i.e. next 6 months) is neutral. Some market studies are medium term bullish while others are medium term bearish
- The stock market’s short term has a bearish lean due to the large probability of a pullback/retest. Focus on the medium-long term (and especially the long term) because the short term is extremely hard to predict.
Goldman Sachs’ Bull/Bear Indicator demonstrates that while the bull market’s top isn’t necessarily in, risk:reward does favor long term bears.

Our discretionary outlook is not a reflection of how we’re trading the markets right now. We trade based on our clear, quantitative trading models, such as the Medium-Long Term Model.
Members can see exactly how we’re trading the U.S. stock market right now based on our trading models.
Click here for more market studies
By Troy Bombardia
I’m Troy Bombardia, the author behind BullMarkets.co. I used to run a hedge fund, but closed it due to a major health scare. I am now enjoying life and simply investing/trading my own account. I focus on long term performance and ignore short term performance.
Copyright 2018 © Troy Bombardia - All Rights Reserved
Disclaimer: The above is a matter of opinion provided for general information purposes only and is not intended as investment advice. Information and analysis above are derived from sources and utilising methods believed to be reliable, but we cannot accept responsibility for any losses you may incur as a result of this analysis. Individuals should consult with their personal financial advisors.
© 2005-2022 http://www.MarketOracle.co.uk - The Market Oracle is a FREE Daily Financial Markets Analysis & Forecasting online publication.