


This is the Stock Market’s Biggest 2 month Rally Since 2009. What’s Next?
Stock-Markets / Stock Markets 2019 Feb 26, 2019 - 04:12 PM GMTBy: Troy_Bombardia

It has been exactly 2 months since the stock market’s bottom on Christmas Eve 2018. Since then, the S&P has rallied more than 18%, which makes this one of the biggest 2 month rallies of all time.
Go here to understand our fundamentals-driven long term outlook.
Let’s determine the stock market’s most probable medium term direction by objectively quantifying technical analysis. For reference, here’s the random probability of the U.S. stock market going up on any given day.

*Probability ≠ certainty. Past performance ≠ future performance. But if you don’t use the past as a guide, you are blindly “guessing” the future.
Earnings recession
Today’s focus on CNBC, Bloomberg, and other major media networks was the impending “earnings recession”.
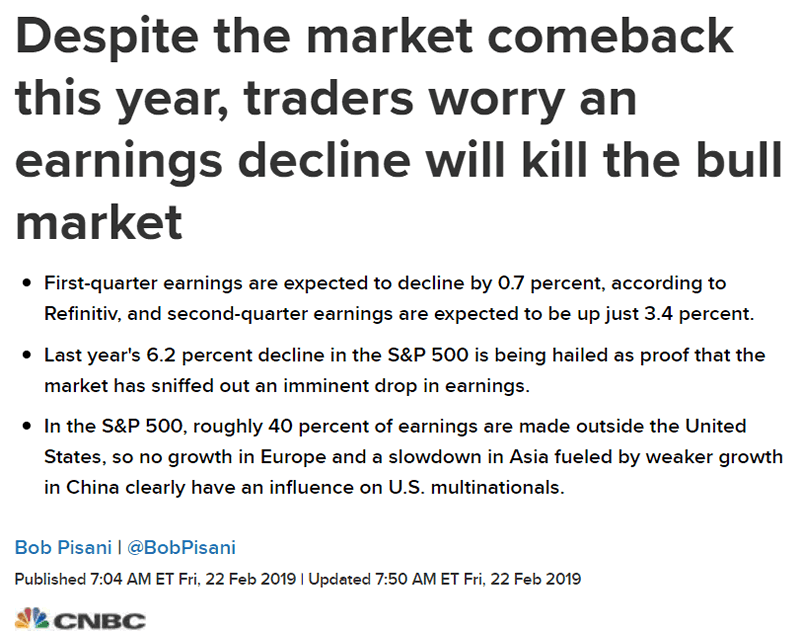
If earnings growth turns negative in Q1 2019, this will indeed be more of a long term bearish sign.
Here’s what happens next to the S&P when earnings growth turns negative.
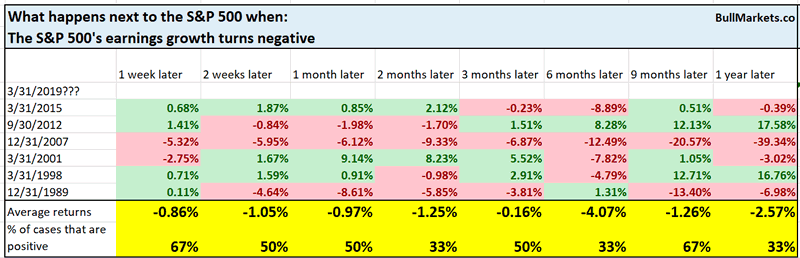
The sample size is small, but this is more of a bearish sign for stocks 6-12 months later. There are some false bearish signals here of course (1998 and 2012), so take this with a grain of salt.
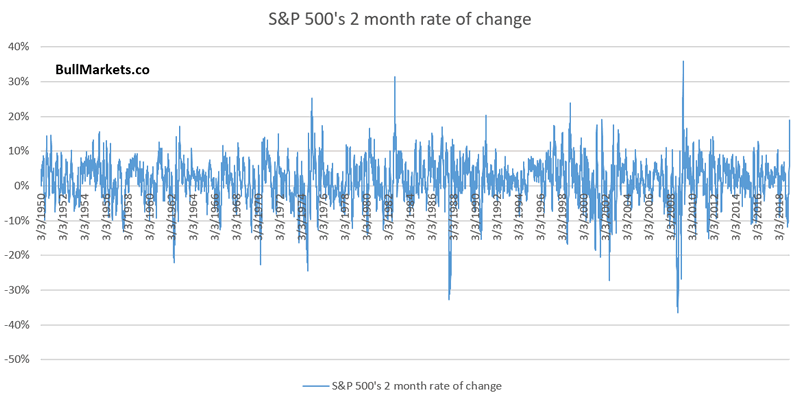
S&P 500’s 2 month rate of change
This has been one of the biggest 2 month rallies in the stock market’s history.

Here’s what happens next to the S&P when it goes up more than 18% over the past 2 months (42 trading days).
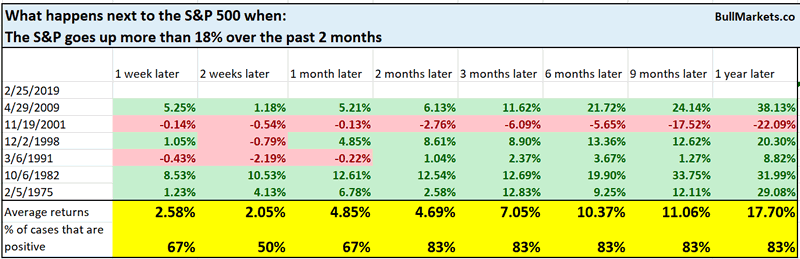
As you can see, this is quite bullish for stocks 2-12 months later, with the exception of November 2001.
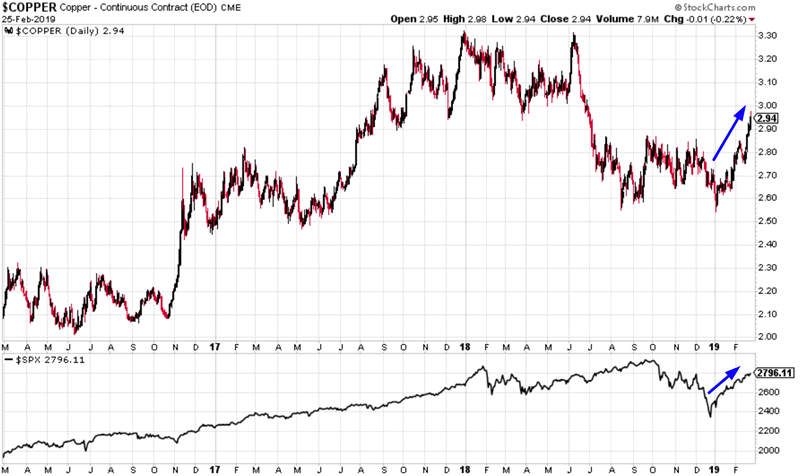
Dr. Copper
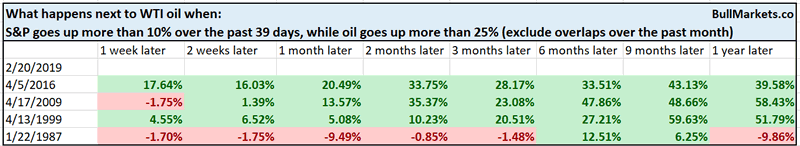
Last week we looked at oil, which has rallied along with the stock market.
This is encouraging for bulls. Oil’s price is heavily influenced by macroeconomic forces in the world.
Another commodity whose price is heavily influenced by macroeconomic forces is copper, also known as Dr. Copper.
Over the past 2 months, copper has gone up more than 10% while the S&P has gone up more than 18%. Does this mean that Dr. Copper is confirming the stock market’s rally?
Here’s what happens next to the S&P when copper goes up more than 10% over the past 2 months, while the S&P goes up more than 15%.
*Data from 1971 – present
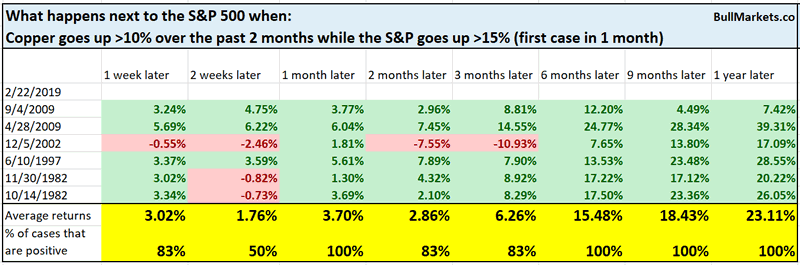
This is quite bullish for the stock market 6-12 months later.
Let’s loosen the study’s parameters to get a larger sample size.
Here’s what happens next to the S&P when copper goes up more than 10% over the past 2 months, while the S&P goes up more than 10%.
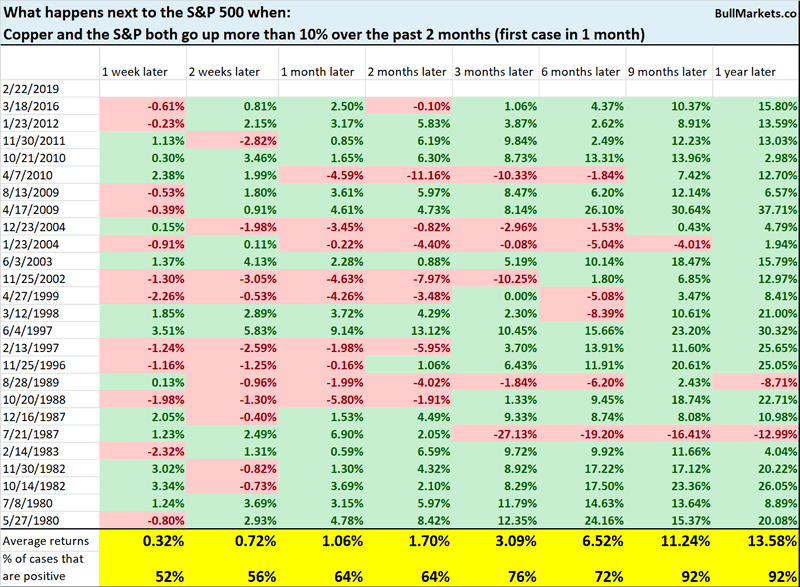
The stock market’s short-medium term is not as consistently bullish, but the stock market’s 9-12 month forward returns are still quite bullish.
From a different perspective, copper seems to be breaking out.
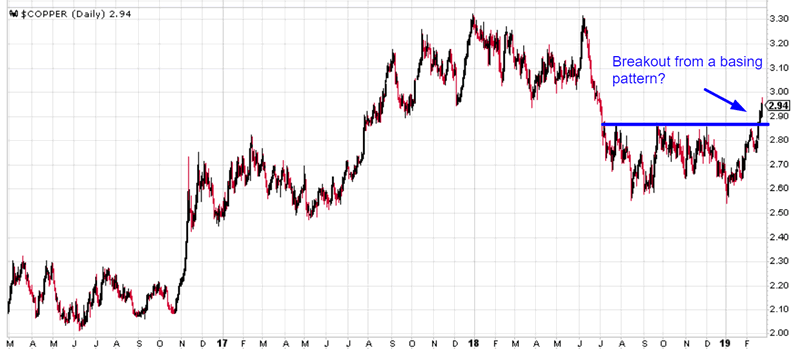
Based on conventional technical analysis, this “breakout” should be bullish for copper.
Is it?
Here’s what happens next to copper when it breaks out to a 160 day high.
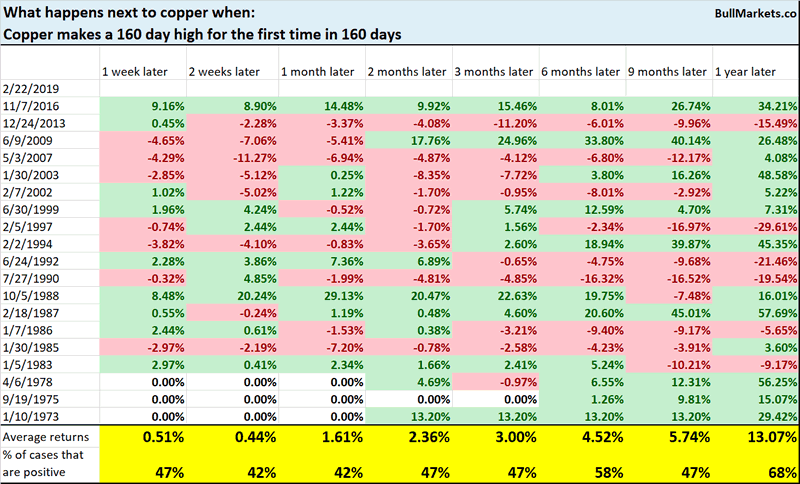
Neither consistently bullish nor bearish for copper.
More breadth
I’ll keep this short, because you probably get the message already. “Yea, breadth is very strong”.
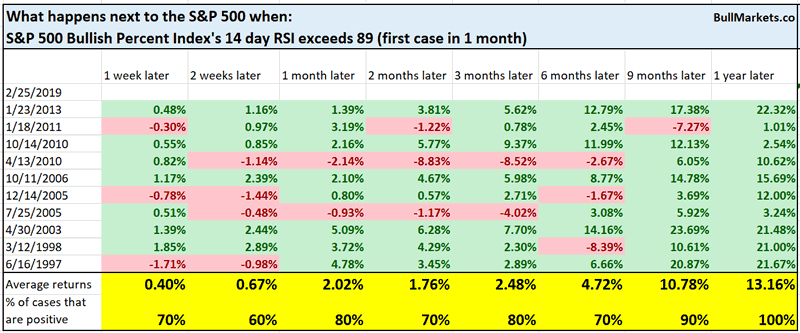
The S&P 500 Bullish Percent Index’s 14 day RSI is extremely high, at 89 right now.
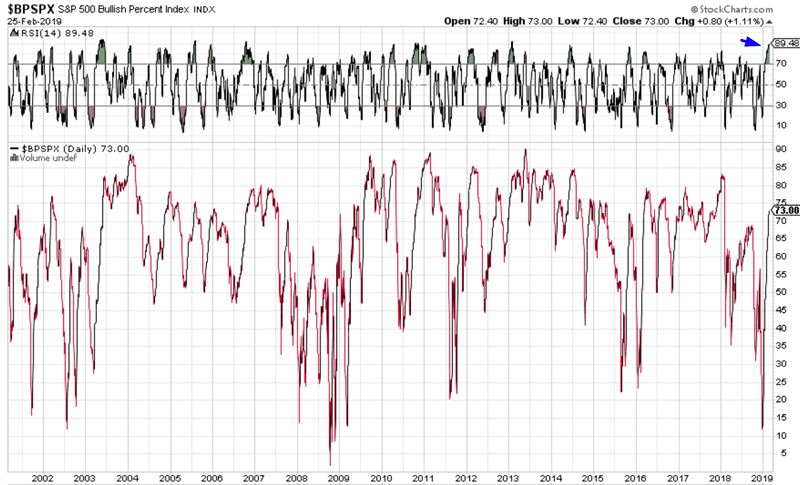
Historically, this is bullish for stocks 9-12 months later.
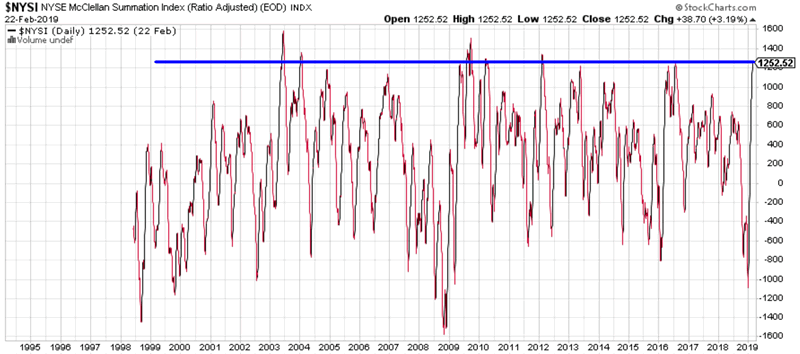
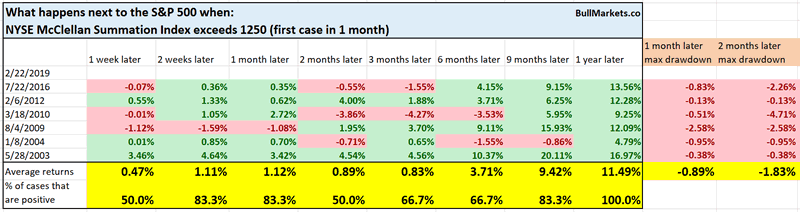
Meanwhile, the NYSE McClellan Summation Index is above 1250. This is a feature of bull markets, not bear market rallies.
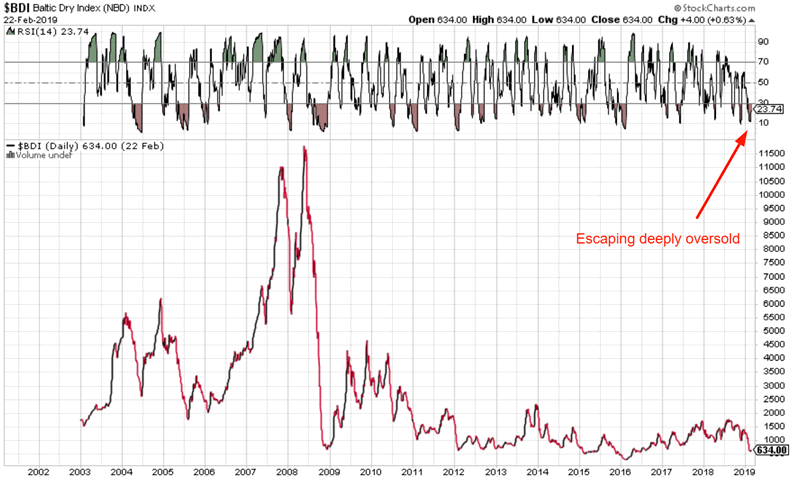
Baltic Dry Index
The Baltic Dry Index is a measure of global shipping. It is escaping from deeply oversold territory.
Here’s what happens next to the S&P when the Baltic Dry Index’s 14 day RSI goes from under 12 to above 23
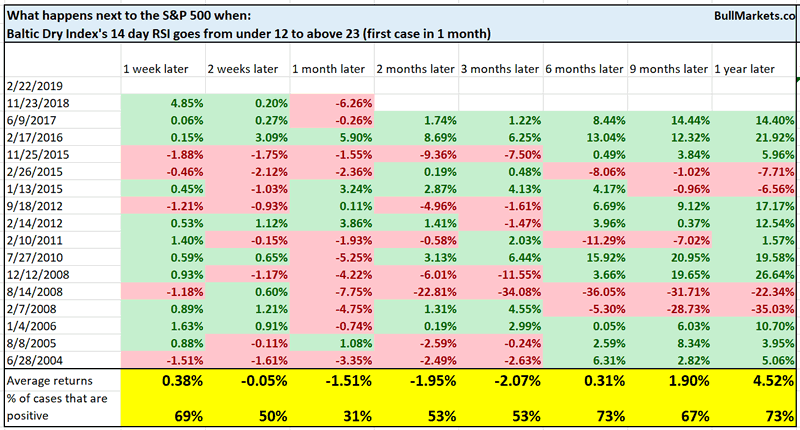
This is not particularly useful for predicting the S&P, although there is a slight bearish lean for stocks 1 month later.
China
China’s stock market surged today on hopes of a China-U.S. trade deal.
As a result, China’s stock market is quite overbought for the first time since January 2018.
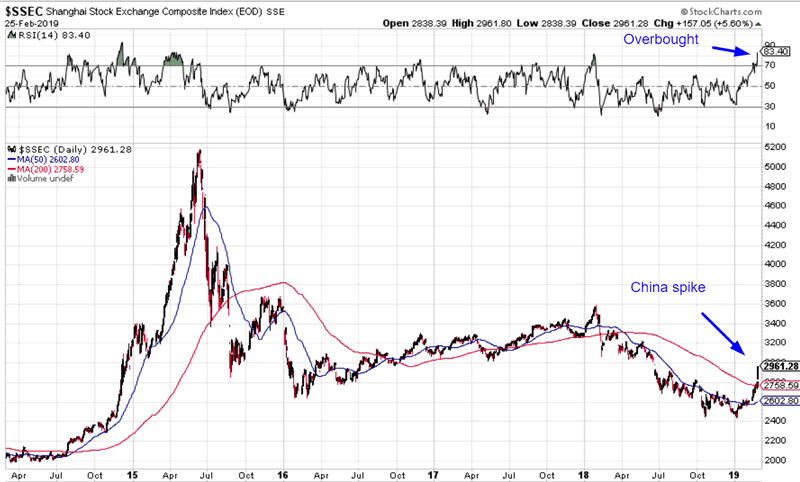
Is this a good sign for Chinese stocks?
Here’s what happens next to the Shanghai Index when its 14 day RSI exceeds 80 for the first time in 1 year
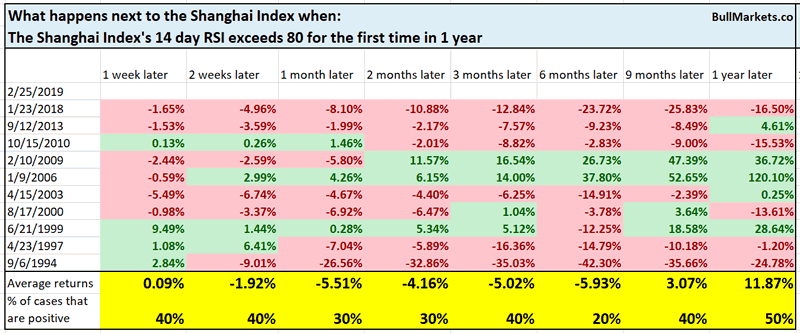
Not consistently bullish for Chinese stocks on any time frame.
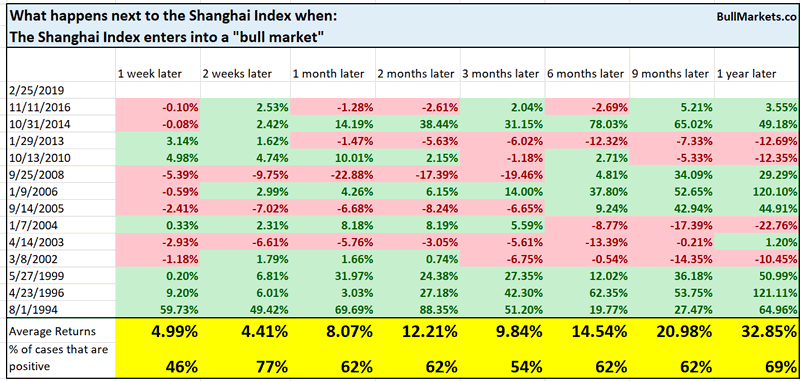
Wall Street conventinally defines a “bull market” as a rally of >20% from a 1 year low. Based on this definition, the Shanghai Index has entered into a bull market. Its forward returns upon doing so are no different from random.
Click here for yesterday’s market study
Conclusion
Here is our discretionary market outlook:
- The U.S. stock market’s long term risk:reward is no longer bullish. In a most optimstic scenario, the bull market probably has 1 year left. Long term risk:reward is more important than trying to predict exact tops and bottoms.
- The medium term direction is more bullish than bearish.
- The stock market’s short term has a bearish lean due to the large probability of a pullback/retest. Focus on the medium-long term (and especially the long term) because the short term is extremely hard to predict.
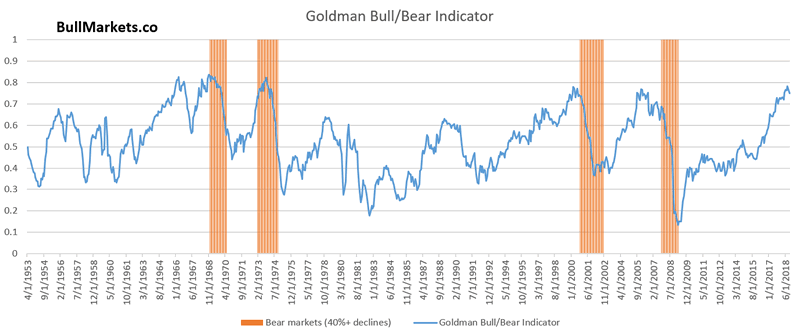
Goldman Sachs’ Bull/Bear Indicator demonstrates that while the bull market’s top isn’t necessarily in, risk:reward does favor long term bears.
Our discretionary outlook is not a reflection of how we’re trading the markets right now. We trade based on our quantitative trading models, such as the Medium-Long Term Model.
Members can see exactly how we’re trading the U.S. stock market right now based on our trading models.
Click here for more market studies
By Troy Bombardia
I’m Troy Bombardia, the author behind BullMarkets.co. I used to run a hedge fund, but closed it due to a major health scare. I am now enjoying life and simply investing/trading my own account. I focus on long term performance and ignore short term performance.
Copyright 2018 © Troy Bombardia - All Rights Reserved
Disclaimer: The above is a matter of opinion provided for general information purposes only and is not intended as investment advice. Information and analysis above are derived from sources and utilising methods believed to be reliable, but we cannot accept responsibility for any losses you may incur as a result of this analysis. Individuals should consult with their personal financial advisors.
© 2005-2022 http://www.MarketOracle.co.uk - The Market Oracle is a FREE Daily Financial Markets Analysis & Forecasting online publication.