


Dear Stocks Bull Market: Happy 10 Year Anniversary!
Stock-Markets / Stock Markets 2019 Mar 07, 2019 - 12:39 PM GMTBy: Troy_Bombardia

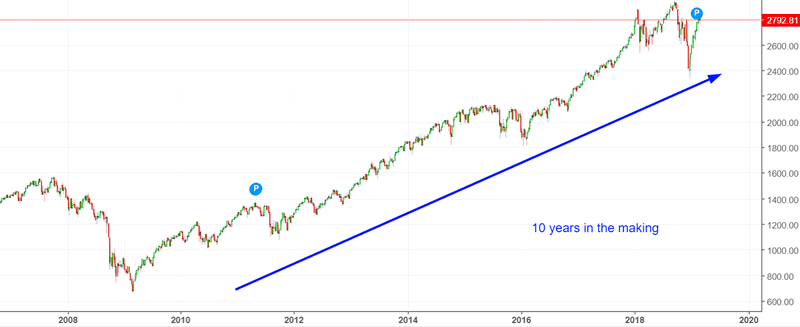
It’s been almost 10 years since this bull market began. What an incredible run. Despite all the doom-and-gloom news reports, this bull market has been impressive. (And no, it’s not because of “evil government manipulation”).
To put this into perspective, someone who bought at the top in 2007 would still have doubled their money (after including dividends reinvested).
Go here to understand our fundamentals-driven long term outlook.
Let’s determine the stock market’s most probable medium term direction by objectively quantifying technical analysis. For reference, here’s the random probability of the U.S. stock market going up on any given day.

*Probability ≠ certainty. Past performance ≠ future performance. But if you don’t use the past as a guide, you are blindly “guessing” the future.
10 years
Here’s the S&P 500’s 10 year-rate-of-change. We accounted for dividends reinvested and inflation: 2 important factors that many market researchers often forget to include.
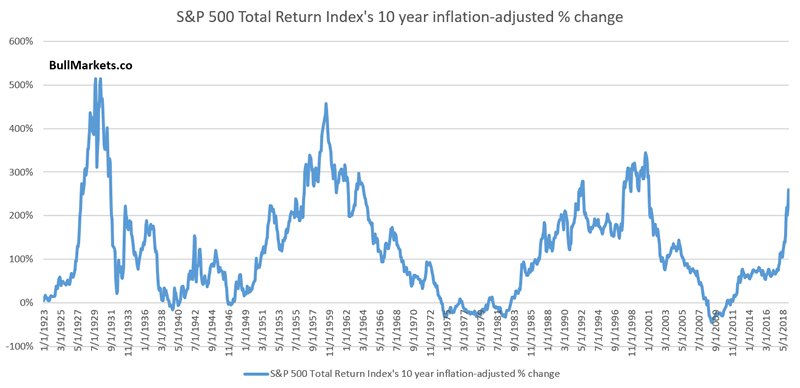
You can see that the S&P’s 10 year rate-of-change is extremely high right now, matching that of the late-1920s, late-1950s, and late-1990s. Suffice to say, the next decade probably won’t be as good for buy and hold investors as the previous decade.
Is this immediately bearish for the stock market?
No.
Here’s what happens next to the S&P when its 10 year rate-of-change exceeds 250%.
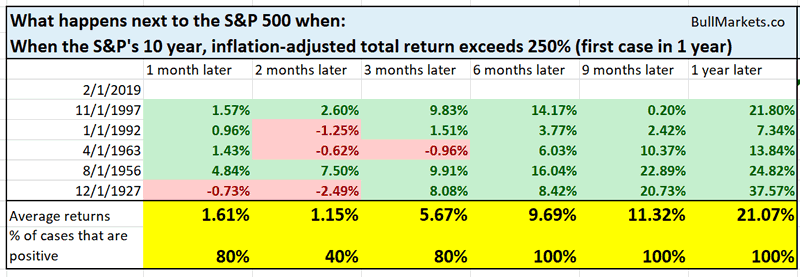
As you can see, a blow-off top is more likely.
I want to caution readers about a popular chart that’s been going around financial media recently.
Here is a chart of the S&P (inflation-adjusted) and its log-scale regression.
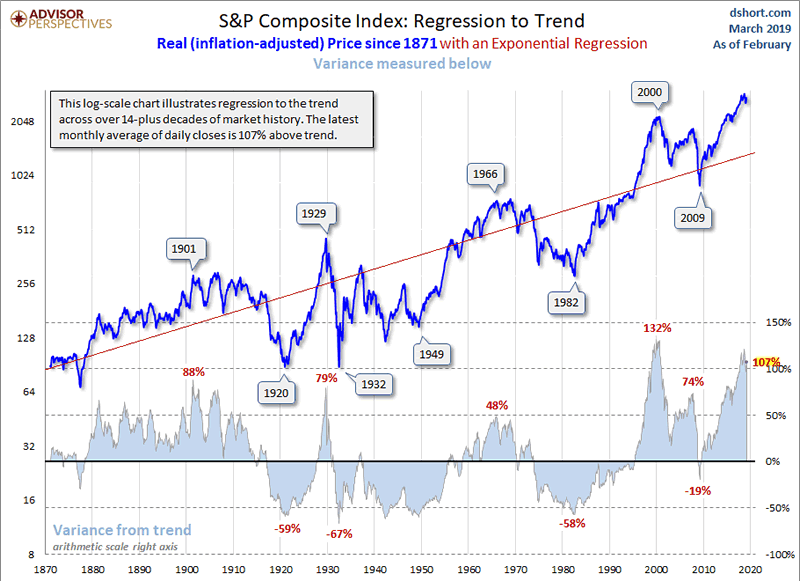
On the surface, the S&P seems to be the 2nd most extended from its regression in history. The only other period of such extension? The dot-com bubble.
This chart is extremely misleading because it looks at the S&P instead of the S&P’s Total Return Index.
Re-examine the above chart. The S&P looks like it went nowhere from 1880 – 1950. How can this be?
- Why did the S&P “go nowhere” from 1880 – 1950?
- Why did the S&P go up from 1950 – present?
The S&P 500 Index excludes dividends. Dividend yields were much higher pre-WWII than post-WWII. Hence, investors in the S&P received most of their gains from 1880-1950 via dividends, whereas investors in the S&P received most of their gains from 1950-present via capital gains.
This means that the above log-scale regression is wrong because it doesn’t include dividends. To ignore dividends is to ignore half of the gains that investors would have received over the past 150 years. These dividends don’t show up on a standard S&P 500 chart, inflation-adjusted or not.
“Too long”
One of the most oft-cited arguments for why this bull market and economic expansion MUST END is because it has gone on for “too long”.
This argument is nonsensical because economic expansions have become longer and longer over the past 100 years.
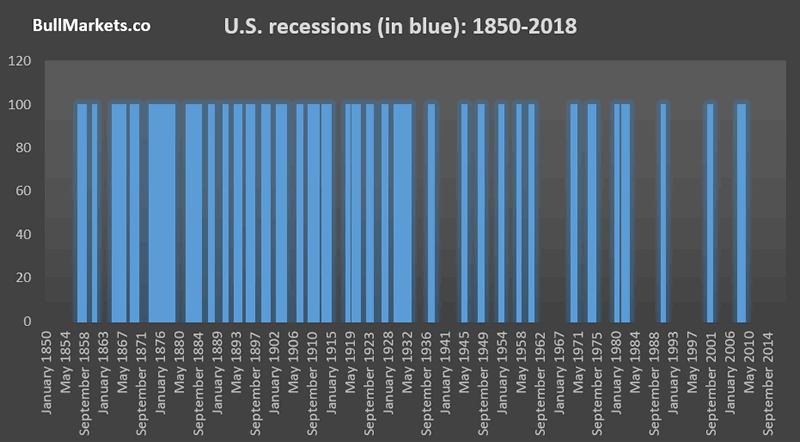
There is no such thing as “economic expansions MUST die after X years”. Economic expansions don’t die of old age. The St. Louis Fed conducted an interesting study on this matter.
Their study looks at the probability of economic expansions ending as time goes on. In other words, how important is time as a factor for ending economic expansions?
The results are very interesting.
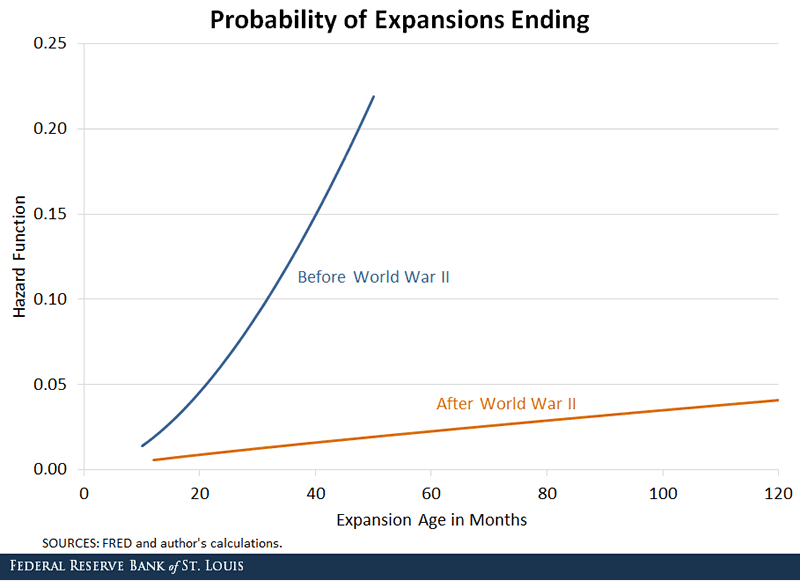
- Pre-WWII, TIME was a good explainer for the death of economic expansions.
- Post-WWII, TIME was a poor explainer for the death of economic expansions.
The main change is that recessions occurred more regularly pre-WWII than post-WWII. The Fed has indeed moderated economic expansions.
Flat top
On the bull market’s 10 year anniversary, it’s a good idea to look at longer term charts for some perspective. Here’s the S&P 500. Notice how the stock market has gone nowhere over the past year?
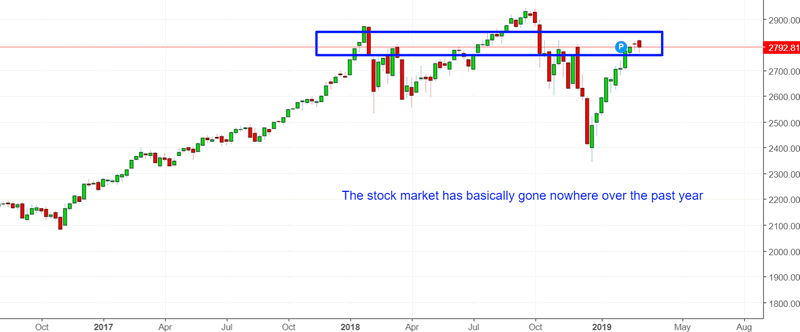
A few weeks ago I said that the S&P 500’s earnings growth could turn negative in Q1 2019 (to be released in April 2019), and that negative earnings growth was generally an unfavorable sign for stocks.
*Data from 1989 – present
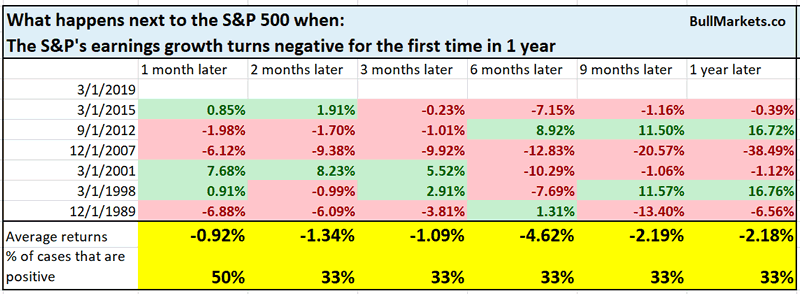
The stock market’s flat price action over the past year seems to have anticipated this decline in earnings growth. Perhaps stocks went nowhere in 2018 because it anticipated that earnings would go nowhere in 2019.
Looking at the same study, we can look at only the cases in which the S&P went up less than 10% over the past year.
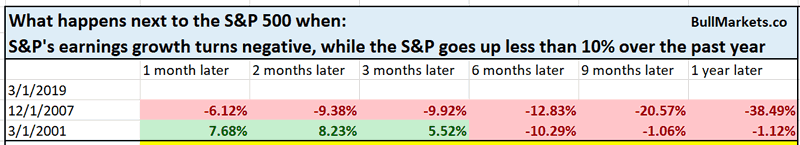
As you can see, the stock market’s reaction to negative earnings growth is important.
- Bullish reactions usually led to more gains over the next year (1989, 1998, 2012, 2015)
- Bearish reactions were bearish signs for stocks (2001, 2007).
This study has yet to be triggered. But if it does get triggered in April 2019, bulls need to watch out. The bull market does not have a lot of room to left to run.
*N=2, so take this study with a grain of salt
Atlanta Fed GDP
The media’s job is to disseminate bad news (bad news = more clicks = more ad $$$). Your job as an investor is to differentiate what’s hyped-up bad news vs. what’s actually something to be worried about.
On a long list of things to be “worried about” (there’s always something to worry about), GDP growth for Q1 2019 could come in at just 0.3%
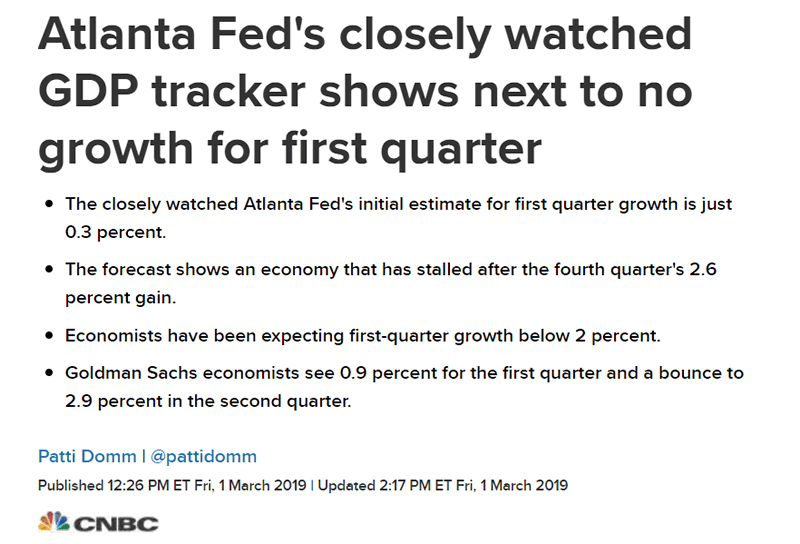
And of course, the bears are banging their heads and raging “how could stocks go up when Q1 GDP growth is going to be so low???? It’s the Fed’s government manipulation!!!!”
Here’s a chart for real GDP growth.
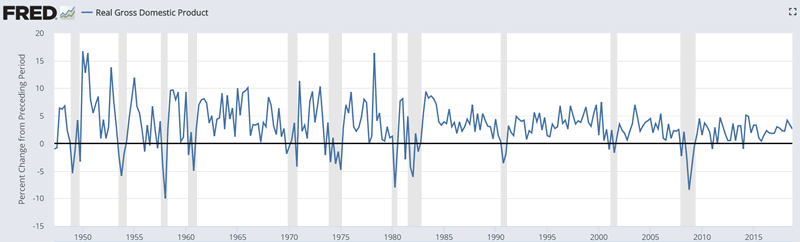
There are a few points to note:
- Quarter-over-quarter GDP growth is very noisy.
- Q1 GDP growth is almost always weak. This is due to “residual seasonality”. There’s nothing special about weak Q1 GDP growth.
Here’s what happens next to the S&P when Q1 real GDP growth is less than 0.5% while the S&P goes up more than 10%.
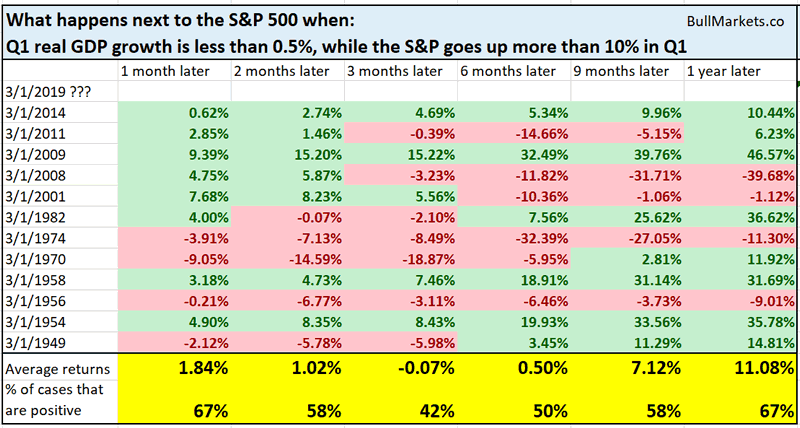
As you can see, this is not extremely bullish or bearish on any time frame, although there is a slight bearish bias 3 months later.
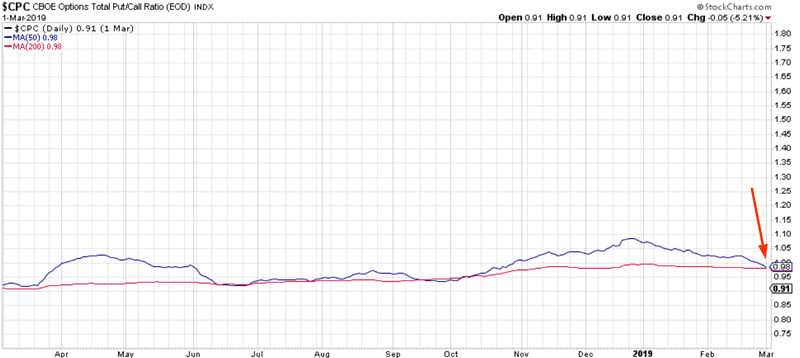
Sentiment
The Put/Call ratio has made a “death cross”, whereby its 50 dma is now below its 200 dma for the first time since October 2018. Fear is subsiding as recency bias enables traders to forget about the stock market’s crash in Q4 2018.
Here are similar historical cases and what the S&P did next.
*Data from 1995 – present
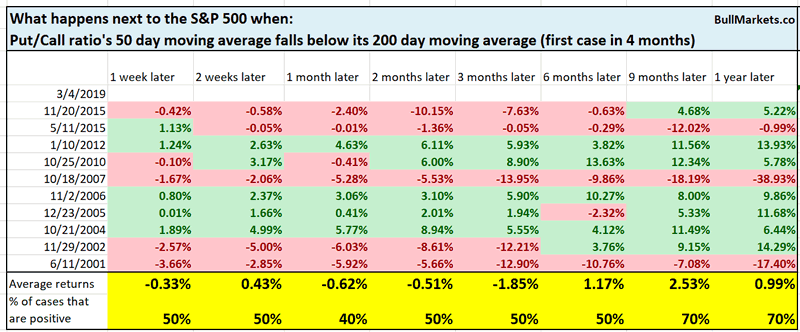
This is a small bearish factor for stocks 1 month later
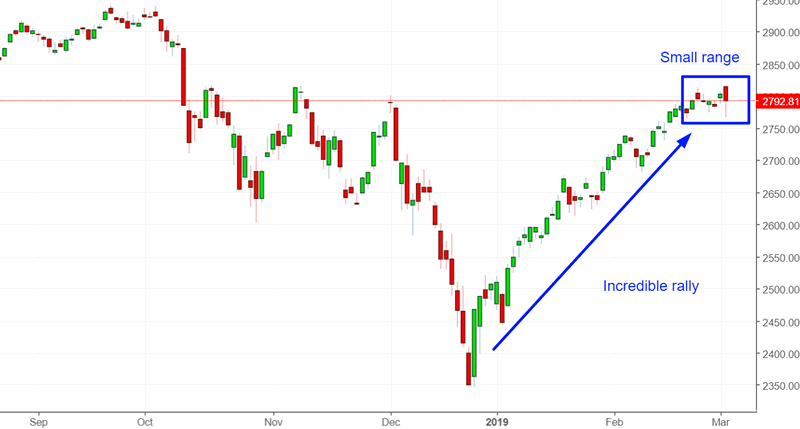
Tight range
The S&P has been stuck in a tight range over the past 7 days after an extremely strong rally. Is the rally coming to an end?
Here’s what happens next to the S&P when its 7 day range is less than 0.7%, after a 10% rally over the past 40 days.
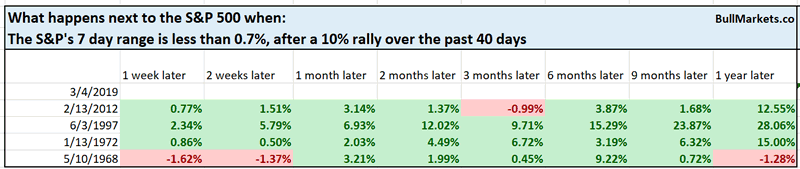
Sample size is small, but this is not a bearish sign for stocks.
XLU
XLU (utilities sector – defensive) made a new high in February while the S&P is still off its highs
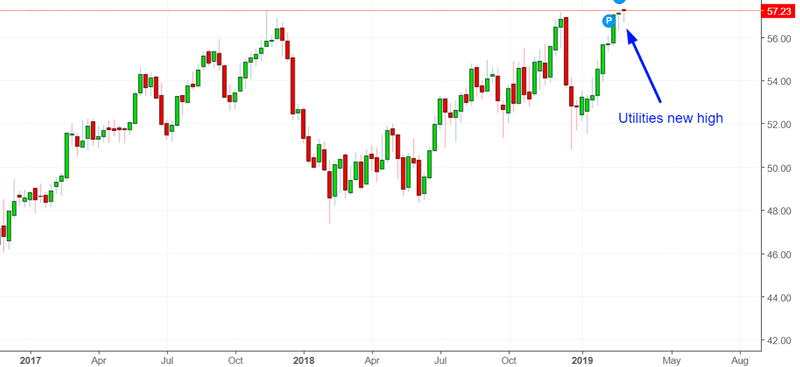
Some bearish traders see this as “reminiscent of 2000 and 2007”. It’s true. This divergence between XLU and the S&P happened at the top of 2000 and 2007. But this also happened in a lot of other years.
Here are all the historical cases in which XLU was at a 1 year high while the S&P was more than -4% below its 1 year high.
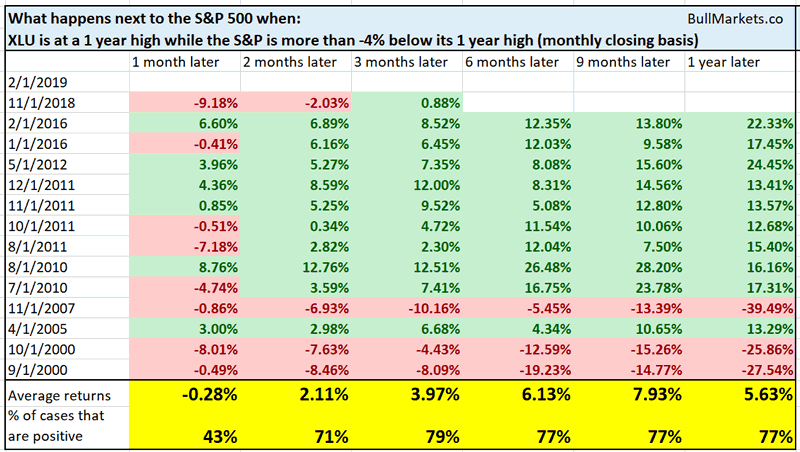
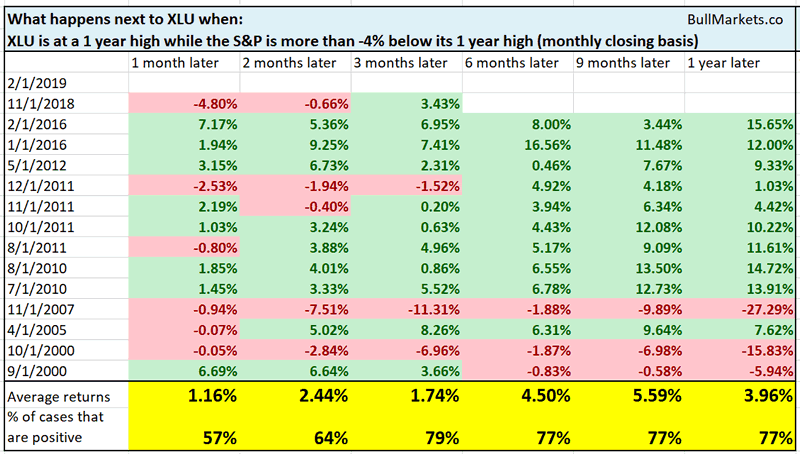
Some bullish and some bearish. Not decisive.
EEM
Many hedge funds, famed traders, and trading gurus were touting emerging markets in 2018. “Buy emerging markets because they’re cheap!” was the standard line.
Reality: emerging markets were clobbered the hardest in 2018. Never buy something just because it is cheap. Something that’s “cheap” is often cheap for good reason.
After being extremely oversold, one would think that emerging markets should rally the hardest in 2019. They haven’t.
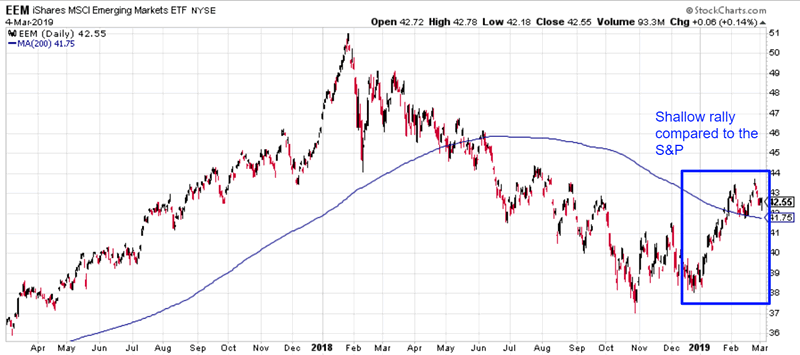
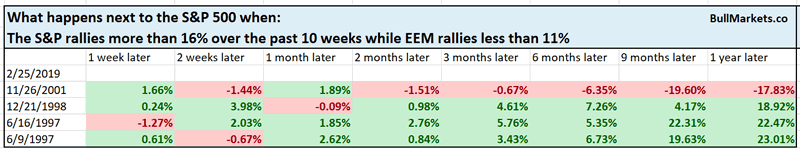
EEM (emerging markets ETF) has rallied less than 11% over the past 10 weeks while the S&P has rallied more than 16%.
From 1996 – present, this divergence has only happened a few times.
- 2019 (now)
- 2001
- 1998
- 1997
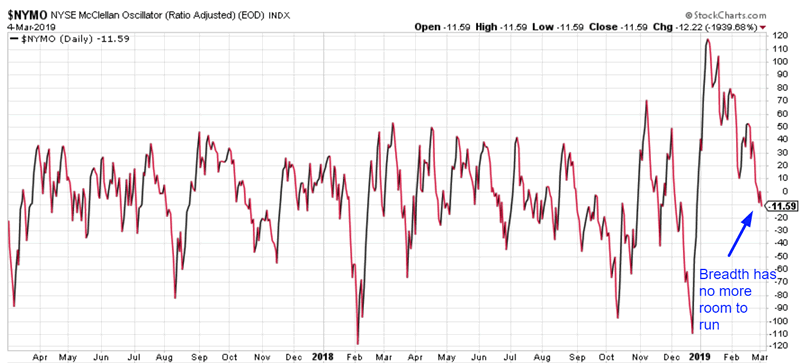
NYSE McClellan Oscillator
Breadth is finally weakening after becoming “as good as it gets”.
Here’s what happens next to the S&P when the NYSE McClellan Oscillator falls below -10% for the first time in 2 months.
*Data from 1998 – present
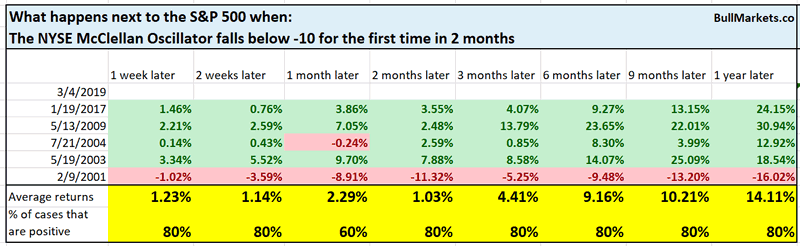
Aside from some potential short term weakness, breadth is not consistently bearish for stocks on any time frame.
Click here for yesterday’s market analysis
Conclusion
Here is our discretionary market outlook:
- The U.S. stock market’s long term risk:reward is no longer bullish. In a most optimistic scenario, the bull market probably has 1 year left. Long term risk:reward is more important than trying to predict exact tops and bottoms.
- The medium term direction (e.g. next 6-9 months) is more bullish than bearish.
- The stock market’s short term has a bearish lean due to the large probability of a pullback/retest. Focus on the medium-long term (and especially the long term) because the short term is extremely hard to predict.
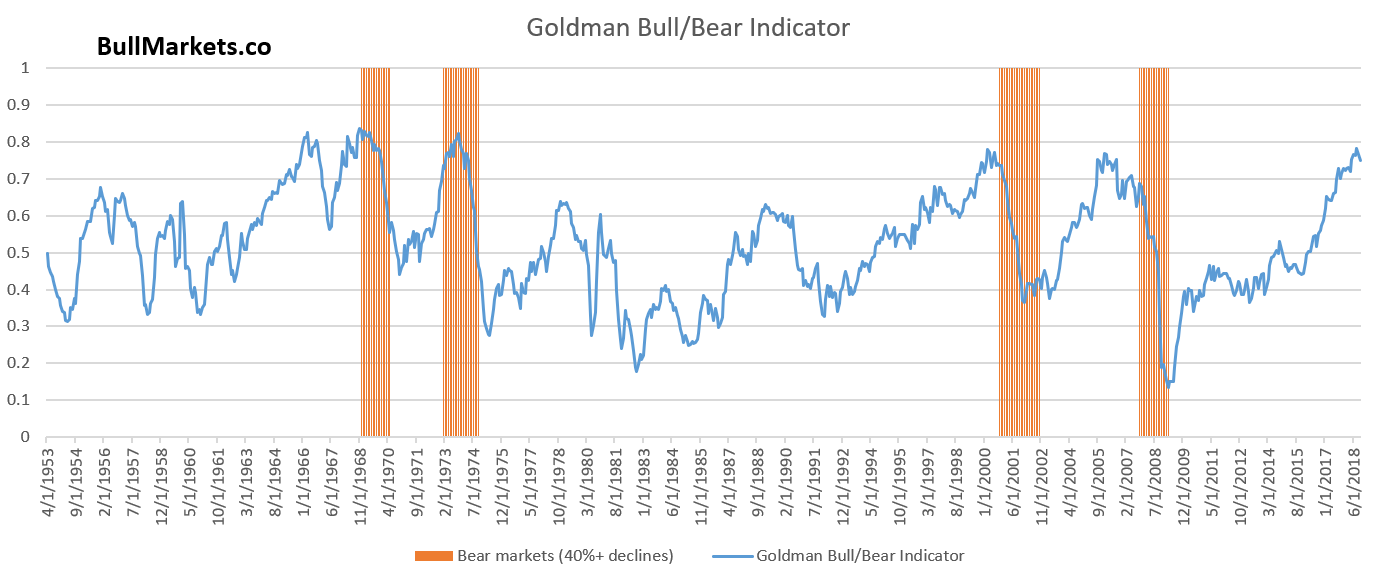
Goldman Sachs’ Bull/Bear Indicator demonstrates that while the bull market’s top isn’t necessarily in, risk:reward does favor long term bears.
Our discretionary outlook is not a reflection of how we’re trading the markets right now. We trade based on our quantitative trading models.
Members can see exactly how we’re trading the U.S. stock market right now based on our trading models.
Click here for more market studies
By Troy Bombardia
I’m Troy Bombardia, the author behind BullMarkets.co. I used to run a hedge fund, but closed it due to a major health scare. I am now enjoying life and simply investing/trading my own account. I focus on long term performance and ignore short term performance.
Copyright 2019 © Troy Bombardia - All Rights Reserved
Disclaimer: The above is a matter of opinion provided for general information purposes only and is not intended as investment advice. Information and analysis above are derived from sources and utilising methods believed to be reliable, but we cannot accept responsibility for any losses you may incur as a result of this analysis. Individuals should consult with their personal financial advisors.
© 2005-2022 http://www.MarketOracle.co.uk - The Market Oracle is a FREE Daily Financial Markets Analysis & Forecasting online publication.