


Watch The Financial Sector For The Next Stock Market Topping Pattern
Stock-Markets / Stock Markets 2019 Apr 17, 2019 - 08:26 AM GMTBy: Chris_Vermeulen

 A very interesting price pattern is setting up in the financial sector that could lead to a very big move in the US & Global markets. Remember how in 2008-09, the Financial sector and Insurance sector were some of the biggest hit stock sectors to prompt a global market crisis? Well, the next few weeks and months for the financial sector are setting up to be critical for our future expectations of the US stock market and global economy.
Right now, many of the financial sector stocks are poised near an upper price channel that must be breached/broken before any further upside price advance can take place. The current trend has been bullish as prices have rallied off the December 2018 lows. Yet, we are acutely aware of the bigger price channels that could become critical to our future decision making. If there is any price weakness near these upper price channel levels and any downside price rotation, the downside potential for the price is massive and could lead to bigger concerns.
Let’s start off by taking a look at these Monthly charts…
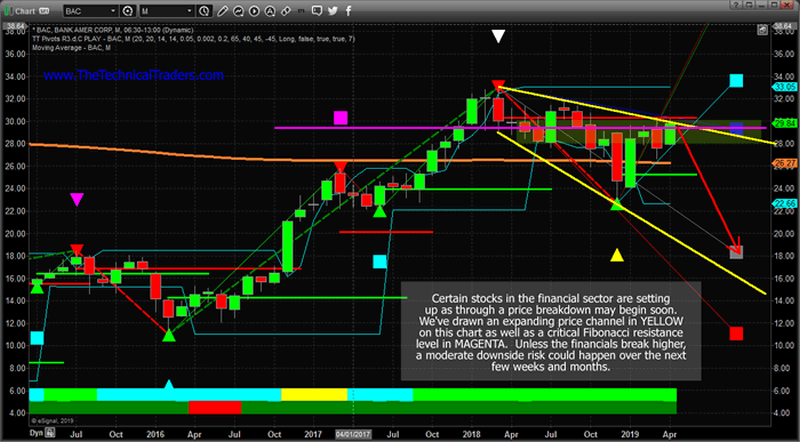
This first Monthly Bank Of America chart is best at showing the price channel (in YELLOW) as well as a key Fibonacci price level (highlighted by the MAGENTA line). We’ve also highlighted a price zone with a green shaded box that we believe is key support/resistance for the current price trend.
As you can see from this chart, since early February 2018, the overall trend has shifted into a sideways bearish trend. The price recovery from December 2018 was impressive, yes, but it is still rotating within this sideways/bearish price channel. Our belief is that this YELLOW upper price channel level MUST be broken in order for the price to continue higher at this point. Any failure to accomplish this will result in a price reversal that could precipitate a 30% price decline in the value of BAC. In other words, “it is do-or-die time – again”.
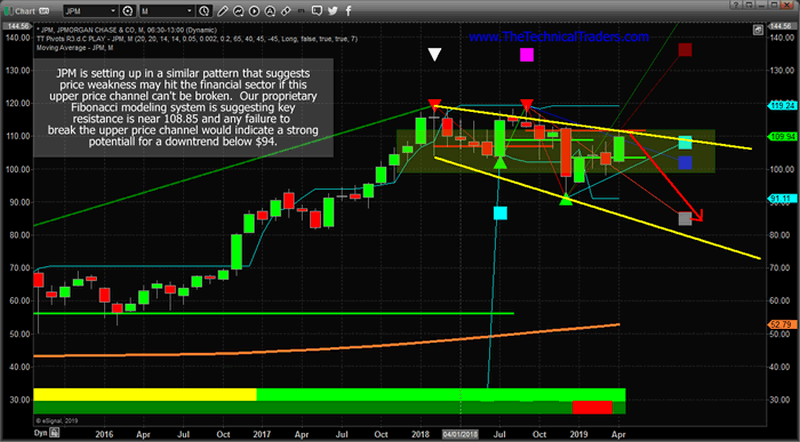
This Monthly JPM chart shows a similar pattern, yet the price channel is a bit more narrow visually. We have almost the same setup in JPM as we do in BAC. The same channels, the same type of Fibonacci price support level, the same type of sideways price support zone (the shaded box) and the same overall setup. As traders, we have to watch for these types of setup and be aware of the risks that could unfold with a collapse of the financial sector over the next few weeks.
We believe the next few weeks could be critical for the financial sector and for the overall markets. If weakness hits the financial sector as global growth continues to stagnate we could enter a period where the global perception of the future 12~24 months may change. Right now, perception has been relatively optimistic in the global stock markets. Most traders have been optimistic that the markets will recover and a US/China trade deal will get settled. The biggest concern has been the EU and the growth of the European countries.
What if that suddenly changed?
We are not saying it will or that we know anything special about this setup. We are just suggesting that the Monthly charts, above, are suggesting that price will either break above this upper price channel or fail to break this level and move lower. We are suggesting that, as skilled traders, we need to be acutely aware of the risks within the financial sector right now and prepare for either outcome.
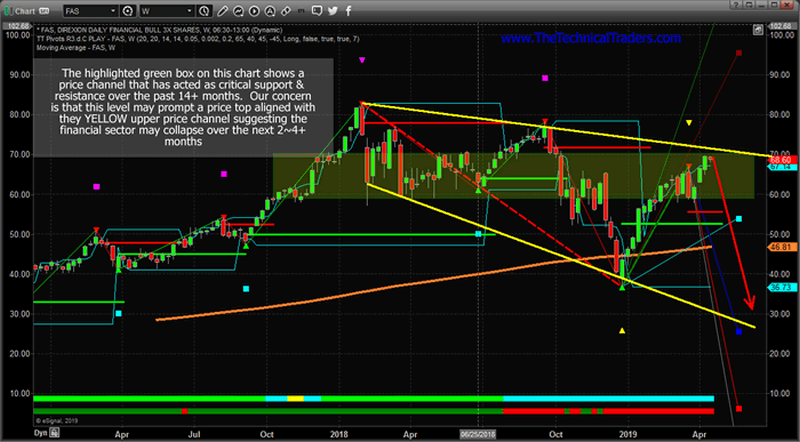
This last chart, a Weekly FAS chart, shows a more detailed view of this same price rotation and sideways expanding wedge/channel formation. Pay very close attention to the shaded support channel shown with the GREEN BOX on this chart. Any price rotation within this level should be considered “within a support channel” and not a real risk initially. We want to see price break above the upper price channel fairly quickly, within the next 2 to 5+ weeks, and we can to see it establish a new high (above $78 on this chart) to confirm a new bullish price trend. Once this happens, we’ll be watching for further price rotation and setups. If it fails to happen, then the RED DOWN ARROW is the most likely outcome given the current price setup.
Any downside price move in the Financial sector would have to be associated with some decreased future expectations by investors. Thus, our bigger concern is that something is lurking just below the surface right now that could pull the floor out from under this sector. Is it a surprise Fed rate increase? Is it some news from the EU? Is it a sudden increase in credit defaults? What is the “other shoe” – so to say.
Be prepared. If all goes well, then we’ll know within a few more weeks if the upside price rally will continue or if we need to start digging for clues as to why the support for the financial sector is eroding. This really is a “do or die” setup in the financial sector and we urge all traders to pay very close attention to this sector going forward. We believe it will be the leading sector for any major price weakness across the global markets.
Do you want to find a team of dedicated researchers and traders that can help you find and execute better trades in 2019 and beyond? Please visit www.TheTechnicalTraders.com to learn how we can help you prepare for the big moves in the global markets and find better opportunities for greater success in the future. Our team of researchers and traders continue to scan the markets for new trades and incredible research for all our members and followers.
Chris Vermeulen
www.TheTechnicalTraders.com
Chris Vermeulen has been involved in the markets since 1997 and is the founder of Technical Traders Ltd. He is an internationally recognized technical analyst, trader, and is the author of the book: 7 Steps to Win With Logic
Through years of research, trading and helping individual traders around the world. He learned that many traders have great trading ideas, but they lack one thing, they struggle to execute trades in a systematic way for consistent results. Chris helps educate traders with a three-hour video course that can change your trading results for the better.
His mission is to help his clients boost their trading performance while reducing market exposure and portfolio volatility.
He is a regular speaker on HoweStreet.com, and the FinancialSurvivorNetwork radio shows. Chris was also featured on the cover of AmalgaTrader Magazine, and contributes articles to several leading financial hubs like MarketOracle.co.uk
Disclaimer: Nothing in this report should be construed as a solicitation to buy or sell any securities mentioned. Technical Traders Ltd., its owners and the author of this report are not registered broker-dealers or financial advisors. Before investing in any securities, you should consult with your financial advisor and a registered broker-dealer. Never make an investment based solely on what you read in an online or printed report, including this report, especially if the investment involves a small, thinly-traded company that isn’t well known. Technical Traders Ltd. and the author of this report has been paid by Cardiff Energy Corp. In addition, the author owns shares of Cardiff Energy Corp. and would also benefit from volume and price appreciation of its stock. The information provided here within should not be construed as a financial analysis but rather as an advertisement. The author’s views and opinions regarding the companies featured in reports are his own views and are based on information that he has researched independently and has received, which the author assumes to be reliable. Technical Traders Ltd. and the author of this report do not guarantee the accuracy, completeness, or usefulness of any content of this report, nor its fitness for any particular purpose. Lastly, the author does not guarantee that any of the companies mentioned in the reports will perform as expected, and any comparisons made to other companies may not be valid or come into effect.
Chris Vermeulen Archive |
© 2005-2022 http://www.MarketOracle.co.uk - The Market Oracle is a FREE Daily Financial Markets Analysis & Forecasting online publication.