


Are Stock Market’s Internals Sending Bearish Warnings?
Stock-Markets / Stock Markets 2019 Apr 26, 2019 - 05:20 PM GMTBy: Troy_Bombardia

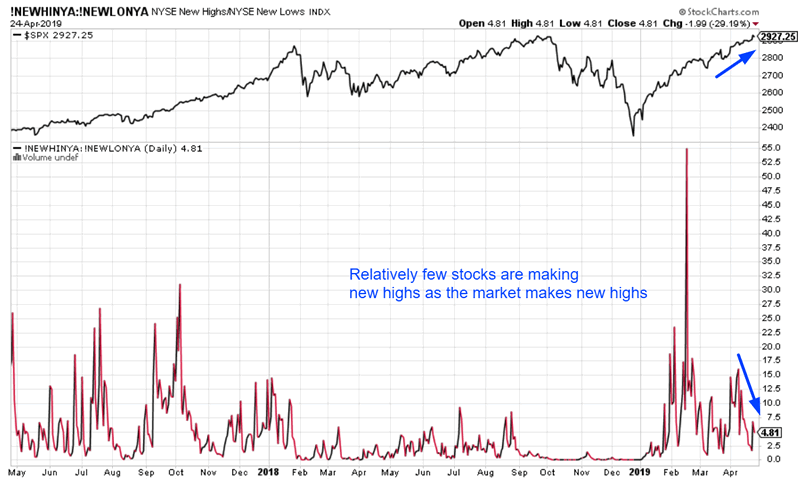
 With the stock market at all-time highs, many market pundits have noted that relatively few stocks are making new highs. In their minds, this supports the bearish narrative that “relatively few stocks are holding this stock market rally together, and sooner or later the house of cards will come tumbling down”.
Go here to understand our fundamentals-driven long term outlook.
Let’s determine the stock market’s most probable medium term direction by objectively quantifying technical analysis. For reference, here’s the random probability of the U.S. stock market going up on any given day.

Bearish narrative
So is the bearish narrative correct? Are “weak breakouts” doomed to fail?
First, we can look at all the cases from 1970-present in which the S&P made a new 52 week high for the first time in at least 6 months.
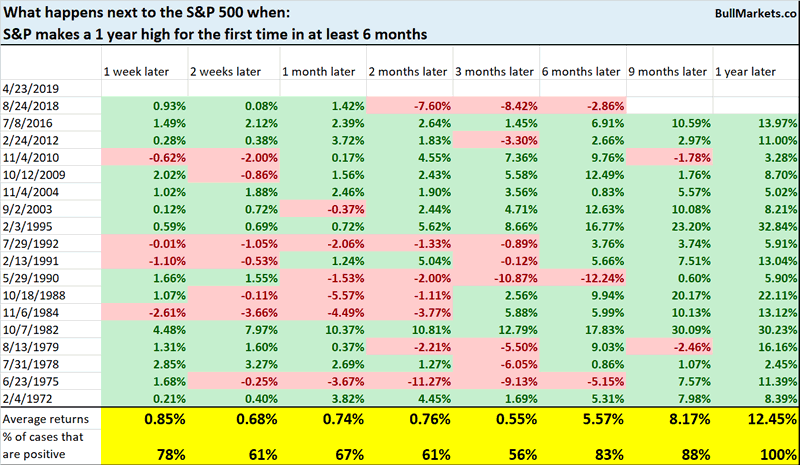
Random on short-medium term time frames, but quite bullish 9-12 months later.
Next, we can narrow down the cases to only look at ones in which the NYSE New Highs vs. New Lows ratio was less than 10.
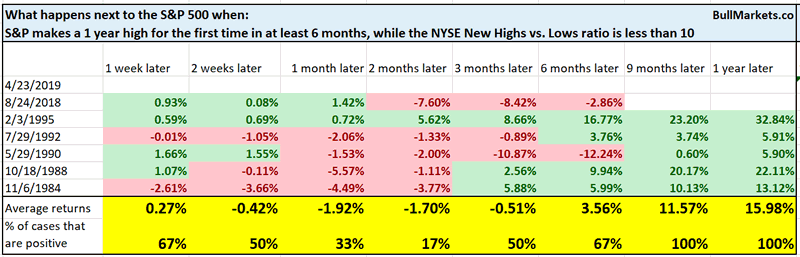
Rare, but you can see that most of these cases saw weakness over the next 1-2 months. Overall, not a terrific short term sign for the stock market.
Not suposed to happen
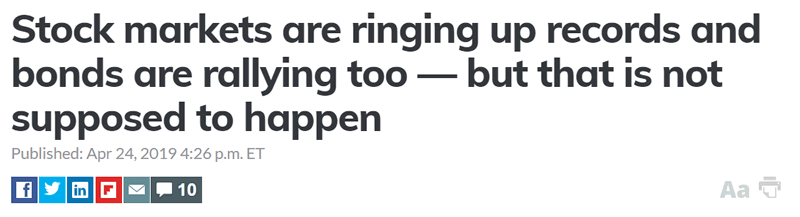
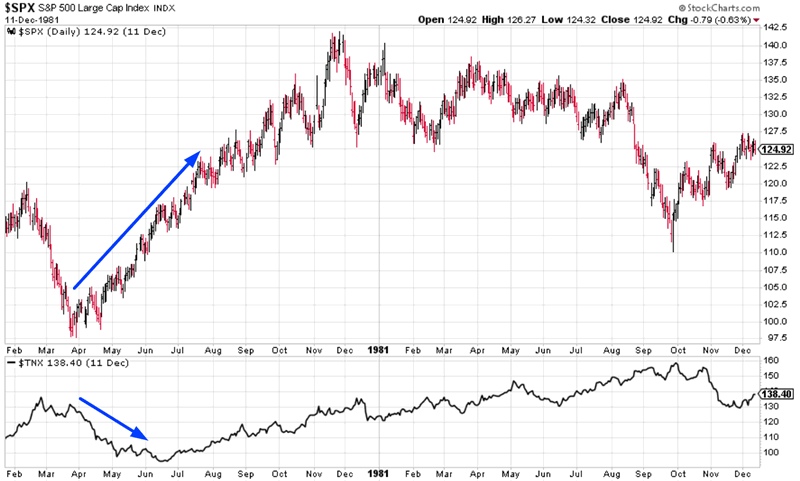
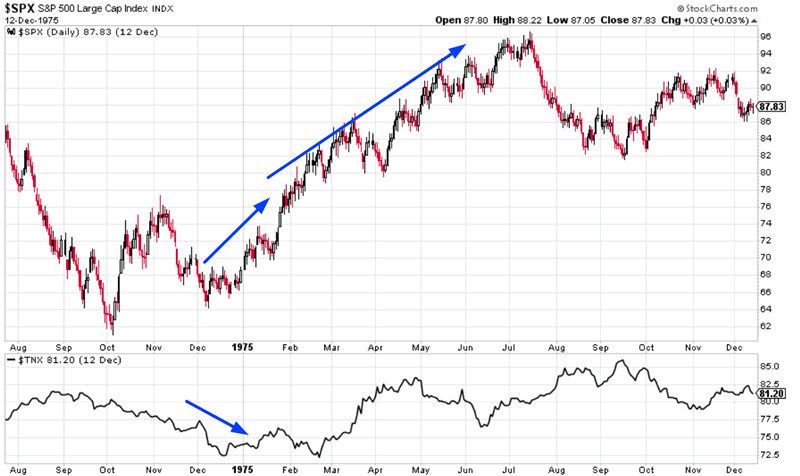
I disagree. While it certainly is rare for stocks and bonds to both rally this much, it certainly isn’t unprecedented.
Here’s what happens next to the S&P when it rallies more than 24% over the past 81 days while TNX falls more than -5% (TNX = CBOE 10 year Treasury yield index).
*Data from 1962 – present
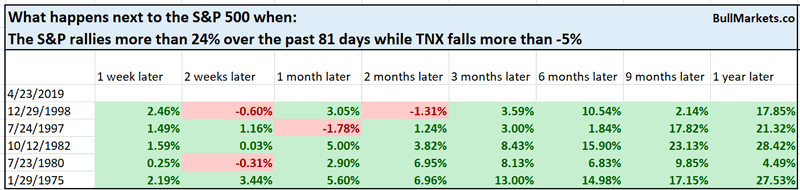
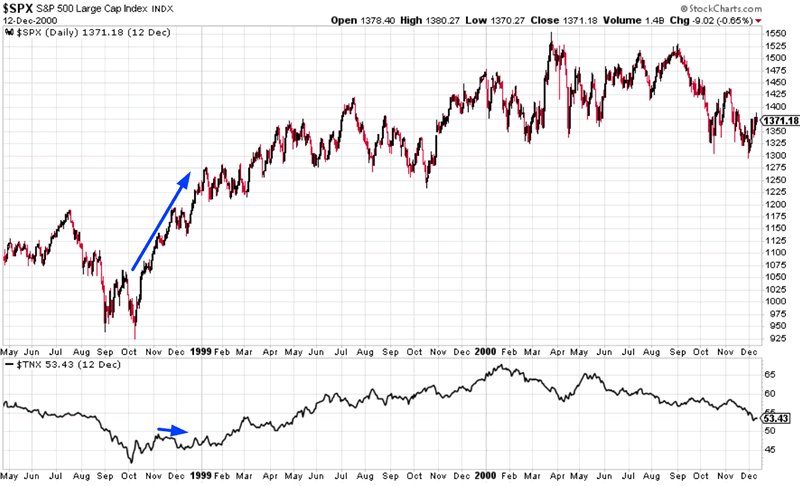
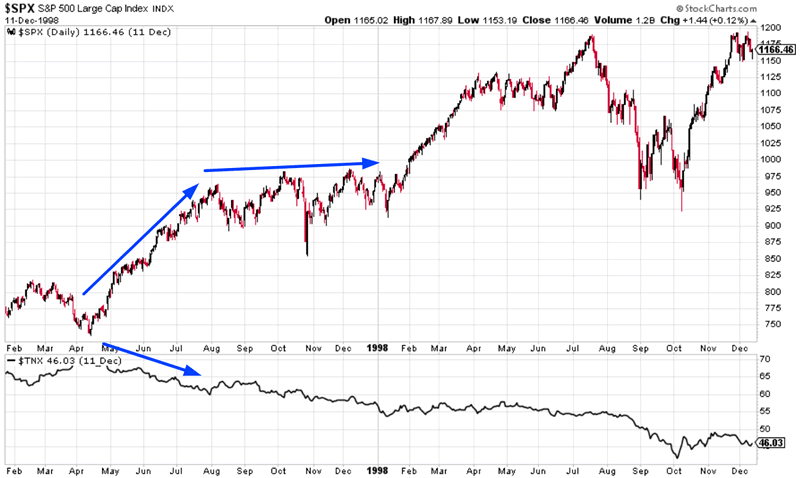
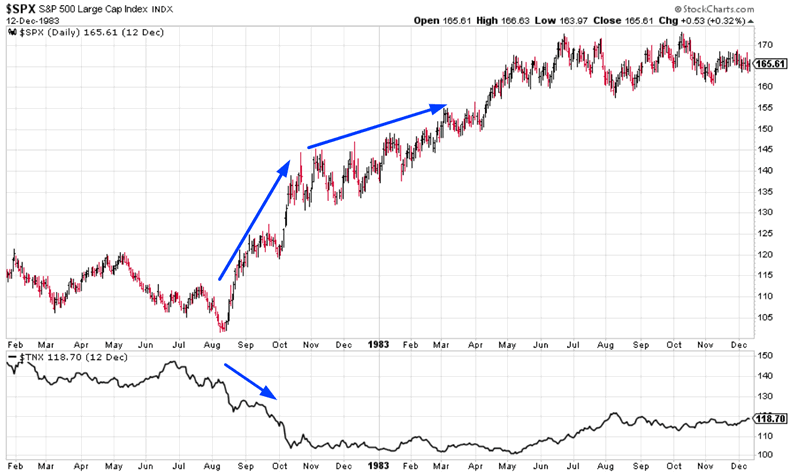
Here’s a quick look at the historical cases.
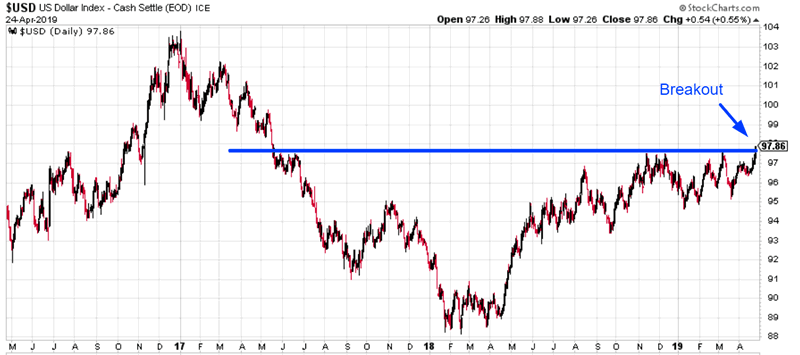
USD
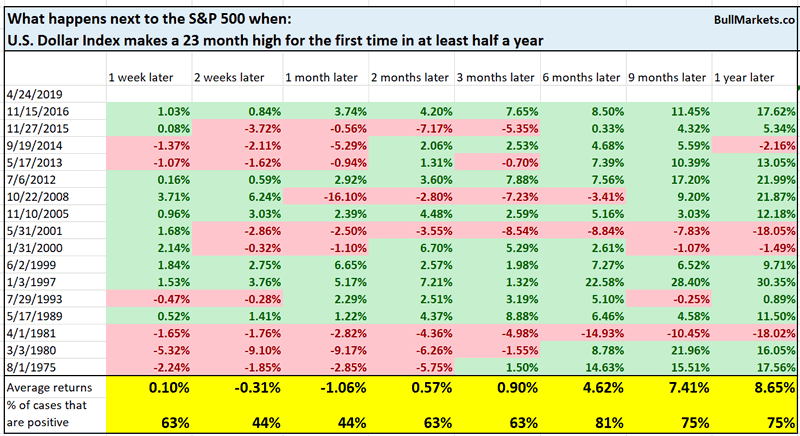
The U.S. Dollar Index broke out today to a 23 month high (almost 2 years).
Here’s what happens next to the USD when it makes a 23 month high for the first time in at least half a year.
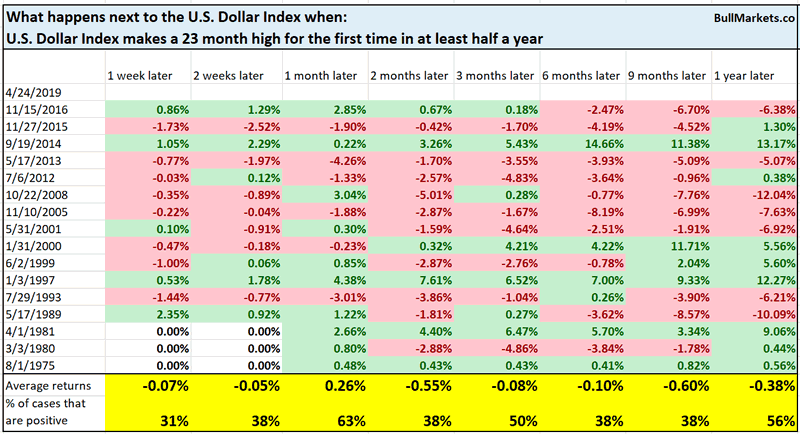
A little bearish on most time frames.
Here’s what happens next to the S&P.
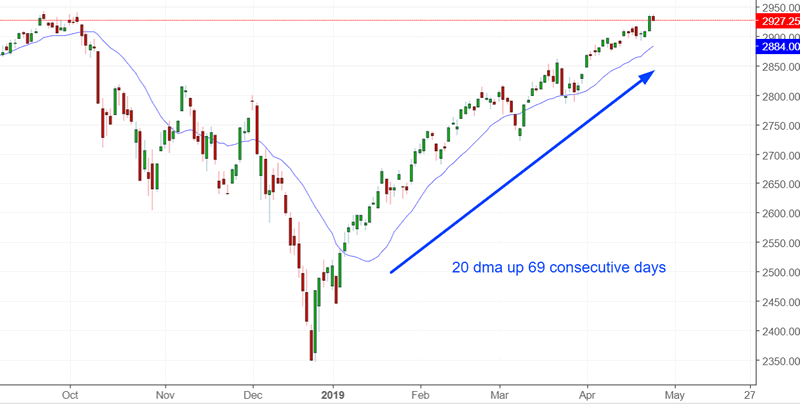
69 days
The S&P’s trend remains solidly upwards, with its 20 day moving average now up 69 consecutive days.
Here’s what happens next to the S&P when its 20 dma rises 69 consecutive days.
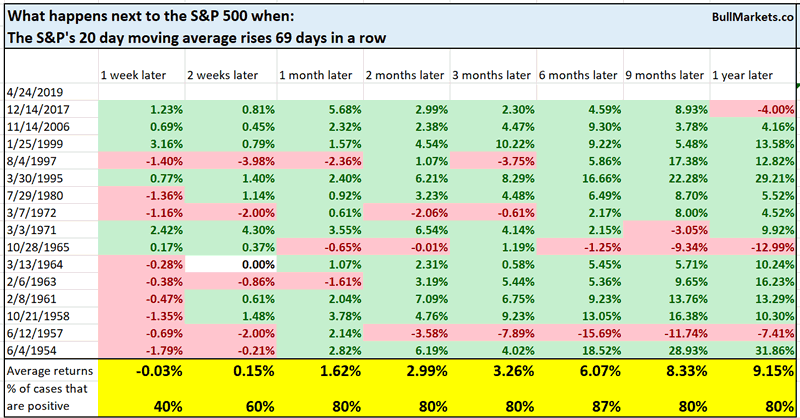
While this trend eventually ends, such a strong trend is usually bullish for stocks in the medium-long term.
Growth vs. value
I saw a chart recently that piqued my interest. Here’s the Russell 2000 Growth vs. Russell 2000 Value Index. As you can see, Growth vs. Value is now where it was during 2000!
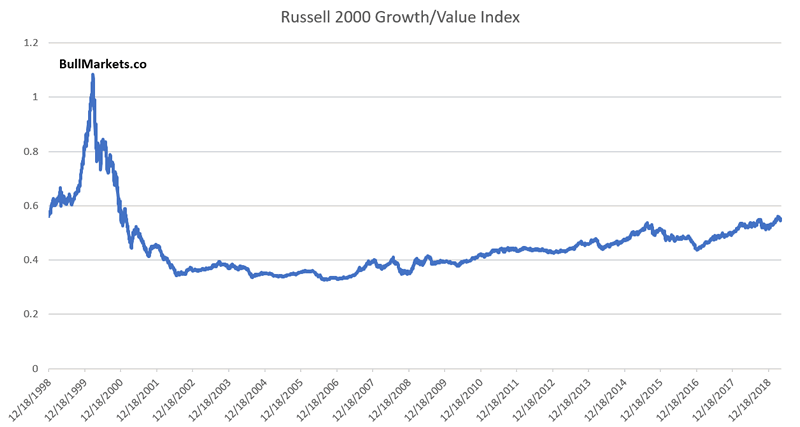
Does this mean that today = the dot-com bubble all over again?
To avoid recency bias, it’s best to look at the data holistically. Here’s the complete data from 1993-present.
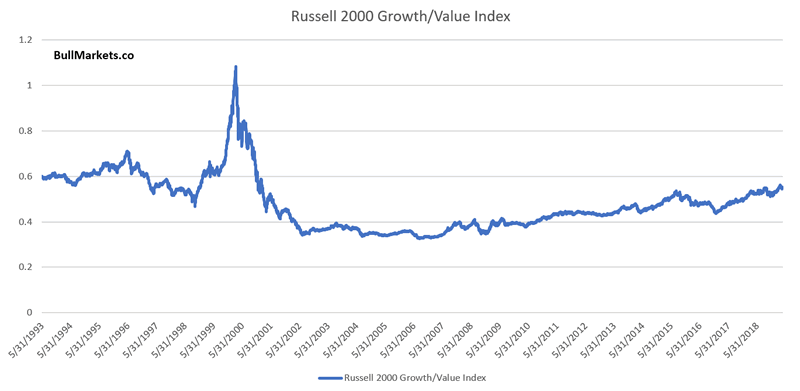
You can see that this ratio remained consistently high throughout the 1990s. So yes, today could be “just like 2000”. Or it could be “just like 1999, 1998, 1997, 1996, 1995, 1994, 1993…”
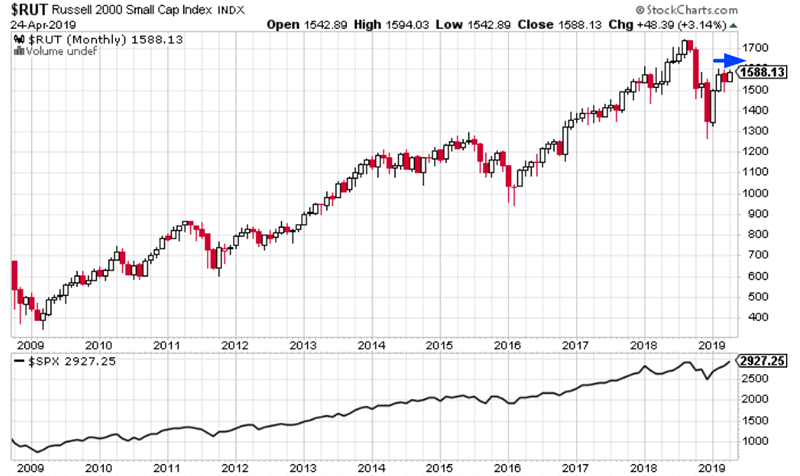
Russell 2000
A Bull Markets member recently poised the question “you’ve looked at the Russell’s underperformance in terms of magnitude. But how about in terms of time? The Russell has consistently underperformed the S&P over the past 2 months”.
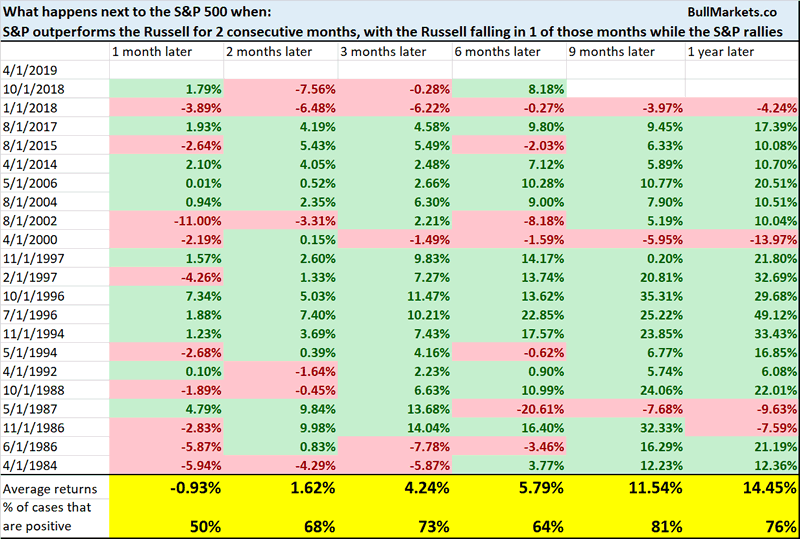
Here’s what happens next to the S&P when it outperforms the Russell for 2 consecutive months, with at least one of those months witnessing a falling Russell while the S&P rallies.
Here’s what happens next to the Russell.

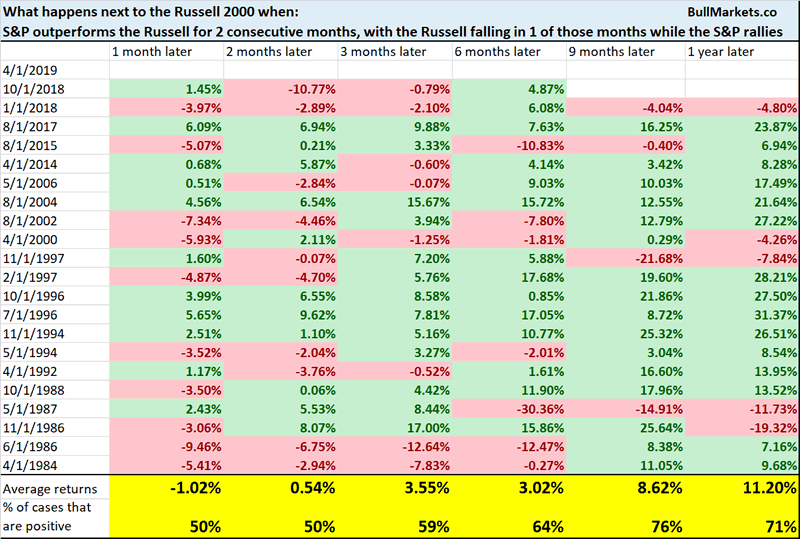
Forward returns are close to random on all time frames
The economy is terrible while the stock market rallies
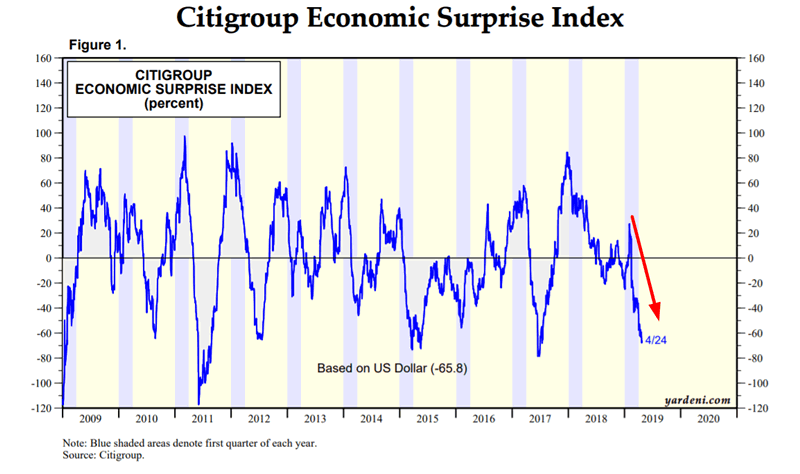
The Citigroup Economic Surprise Index is very low. As a result, many market watchers are raging “how can the stock market go up when the economy is terrible!?!?!? Must be the Plunge Protection Team and evil Central Bank again!!!!”
In trading as in life, I find that it’s generally more useful to assume “I’m missing something” when I’m consistently wrong, and then figure out what it is that I’m missing.
- Sometimes I’ll come to the conclusion that the market is irrational and that I’ll soon be proven right.
- Sometimes I’ll figure out what it is that I’m missing, which is something that I can use in the future to improve and avoid similar mistakes.
So why is the stock market going up while “the economy is terrible”? Let’s ask the makers of the Citigroup Economic Surprise Index. From FT
So there you have it. The Citigroup Economic Surprise Index was not built to predict the U.S. stock market. It was built to predict currency moves.
Moreover, the Citigroup Economic Surprise Index does not accurately reflect the state of the economy. It’s meant to measure the data vs expectations. These 2 things are not the same thing. For example, while the Citigroup Economic Surprise Index is very “weak” right now, our own Macro Index has been decent since the start of January 2019. Our Macro Index measures the state of the economy, regardless of analysts’ expectations.
Read It’s been a quick recovery for the stock market to all-time highs
Conclusion
Here is our discretionary market outlook:
- The U.S. stock market’s long term risk:reward is no longer bullish. In a most optimistic scenario, the bull market probably has 1 year left. Long term risk:reward is more important than trying to predict exact tops and bottoms.
- The medium term direction (e.g. next 6-9 months) is mostly mixed, although there is a bullish lean.
- We don’t predict the short term because the short term is always extremely random, no matter how much conviction you think you have. Focus on the medium-long term.
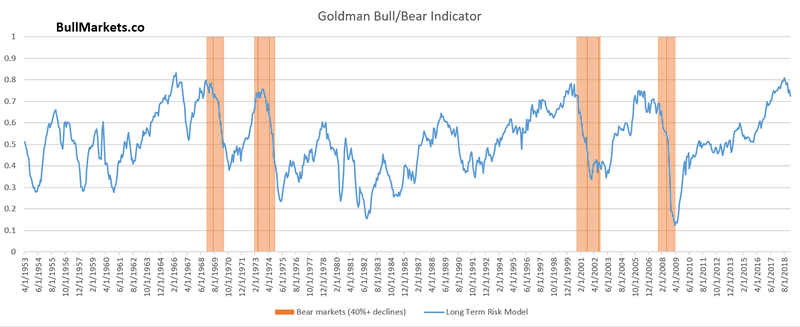
Goldman Sachs’ Bull/Bear Indicator demonstrates that risk:reward does favor long term bears.
Our discretionary outlook is not a reflection of how we’re trading the markets right now. We trade based on our quantitative trading models.
Members can see exactly how we’re trading the U.S. stock market right now based on our trading models.
Click here for more market studies
By Troy Bombardia
I’m Troy Bombardia, the author behind BullMarkets.co. I used to run a hedge fund, but closed it due to a major health scare. I am now enjoying life and simply investing/trading my own account. I focus on long term performance and ignore short term performance.
Copyright 2019 © Troy Bombardia - All Rights Reserved
Disclaimer: The above is a matter of opinion provided for general information purposes only and is not intended as investment advice. Information and analysis above are derived from sources and utilising methods believed to be reliable, but we cannot accept responsibility for any losses you may incur as a result of this analysis. Individuals should consult with their personal financial advisors.
© 2005-2022 http://www.MarketOracle.co.uk - The Market Oracle is a FREE Daily Financial Markets Analysis & Forecasting online publication.