


How Close is the Stock Market From Topping?
Stock-Markets / Stock Markets 2019 May 01, 2019 - 02:58 PM GMTBy: Chris_Vermeulen

 Now that most of the US Major Indexes have breached new all-time price highs, which we called over 5+ months ago, and many traders are starting to become concerned about how and where the markets may find resistance or begin to top, we are going to try to paint a very clear picture of the upside potential for the markets and why we believe volatility and price rotation may become a very big concern over the next few months. Our objective is to try to help you stay informed of pending market rotation and to alert you that we may be nearing a period within the US markets where increased volatility is very likely.
Longer term, many years into the future, our predictive modeling systems are suggesting this upside price swing is far from over. Our models suggest that price rotation will become a major factor over the next 12 to 15+ months – headed into the US Presidential election cycle of November 2020. Our models are suggesting that the second half of this year could present an incredible opportunity for skilled investors as price volatility/rotation provide bigger price swings. Additionally, our models suggest that early 2020 will provide even more opportunity for skilled traders who are able to understand the true price structure of the markets. Get ready, thing are about to get really interesting and if you are not following our research or a member of our services, you might want to think about joining soon.
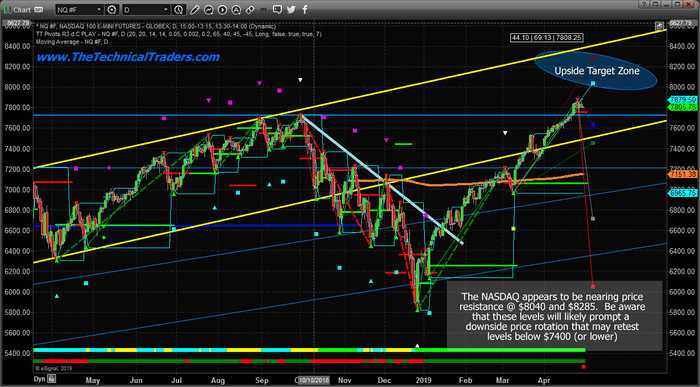
We are focusing this research post on the NQ, ES and YM futures charts (Daily). We will include a longer-term YM chart near the end to highlight longer-term expectations. Let’s start with the NQ Daily chart.
The NQ Daily chart, below, highlights our ongoing research, shows the 2018 deep price rotational low and the incredible rally to new all-time highs recently. The most important aspect of this chart is the “Upside Target Zone” near the $8040 level and the fact that any rally to near these levels would represent an extended upside price rally near the upper range of the YELLOW price channel lines. We believe any immediate price rotation may end near the $7500 level (between the two Fibonacci Target levels near $7400 & $7600) and could represent a pretty big increase in price volatility.
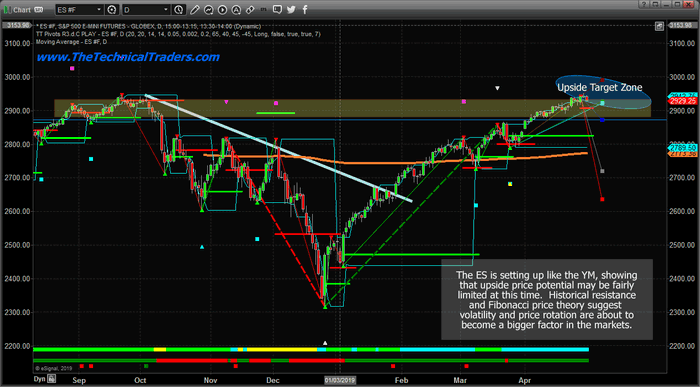
This ES Daily chart highlights the different in capabilities between the NQ and the ES. While the NQ is already pushing into fairly stronger new price highs, the ES is struggling to get above the Sept/Oct 2018 highs and this is because very strong resistance is found between $2,872 and $2,928. It is very likely that the price volatility will increase near these highs as price becomes more active in an attempt to break through this resistance. It is also very likely that a downside price rotation may happen where price attempts to retest the $2,835 level (or lower) before finally pushing into a bigger upside price trend. The Upside Target Zone highs are just below $3,000. Therefore, we believe any move above $2,960 could represent an exhaustion top type of price formation.
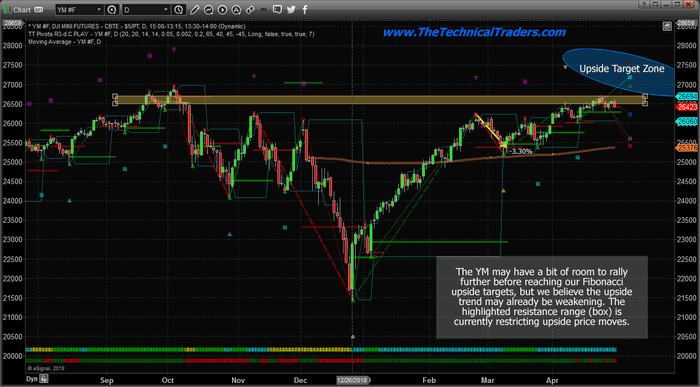
This YM chart is set up very similarly to the ES chart. Historical price highs are acting as a very strong price ceiling. While the NQ is already pushing into fairly stronger new price highs, the YM continues to struggle to get above the Sept/Oct 2018 highs and this is because very strong resistance is found between 25,750 and 27,000. Please take notice of the very narrow resistance channel (BOX) on this chart that highlights where we believe true price support/resistance is located. We believe it is likely that a downside price rotation may happen where price attempts to retest the $26,000 level (or lower) before finally pushing into a bigger upside price trend.
As you can tell from our recent posts and this research, we believe price volatility is about to skyrocket higher as price rotates downward. Our predictive modeling systems are suggesting that we are nearing the end of this current upside move where a downward price move will establish a new price base and allow price to, eventually, push much higher – well above current all-time high levels.
We’ve issued research posts regarding Presidential election cycles and how, generally, stock market prices decline 6 to 24 months before any US Presidential election. We believe this pattern will continue this year and we are warning our followers to be prepared at this stage of the game. No, it will not be a massive market crash like 2008-09. It will be a downside price rotation that will present incredible opportunities for skilled traders. If you want more of our specialized insight and analysis, then please visit www.TheTechnicalTraders.com to learn how we help our members find success.
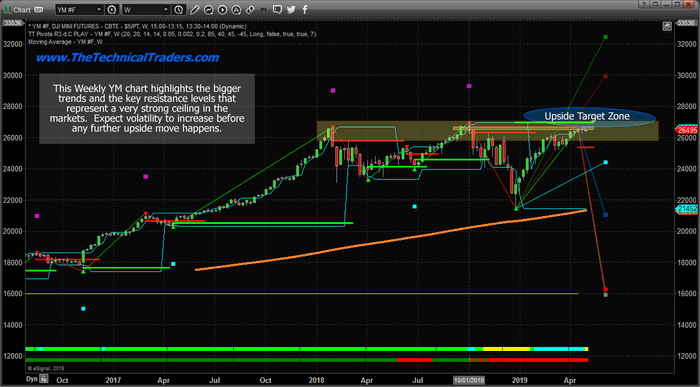
Lastly, we’ve included this Weekly YM chart to show you just how volatile the markets are right now. Pay very close attention to the Fibonacci Target Levels that are being drawn on this chart. The downside target levels range from $16,000 to $21,060. The upside target levels range from $30,000 to $32,435. Top to bottom, The Fibonacci price modeling system is suggesting a total volatility range of over $16,000 for the YM Weekly chart and this usually suggests we are about to enter a period of bigger price rotation and much higher price volatility.
Right now, we suggest that you review some of our most recent posts to see how we’ve been calling these market moves, visit www.TheTechnicalTraders.com/FreeResearch/. It is important for all of our followers to understand the risks of being complacent right now. The markets are about to enter a period of about 24+ months where incredible opportunities will become evident for skilled traders. If you know what is going to happen, you can find opportunities everywhere. If not, you are going to be on the wrong side of some very big moves.
Chris Vermeulen
www.TheTechnicalTraders.com
Chris Vermeulen has been involved in the markets since 1997 and is the founder of Technical Traders Ltd. He is an internationally recognized technical analyst, trader, and is the author of the book: 7 Steps to Win With Logic
Through years of research, trading and helping individual traders around the world. He learned that many traders have great trading ideas, but they lack one thing, they struggle to execute trades in a systematic way for consistent results. Chris helps educate traders with a three-hour video course that can change your trading results for the better.
His mission is to help his clients boost their trading performance while reducing market exposure and portfolio volatility.
He is a regular speaker on HoweStreet.com, and the FinancialSurvivorNetwork radio shows. Chris was also featured on the cover of AmalgaTrader Magazine, and contributes articles to several leading financial hubs like MarketOracle.co.uk
Disclaimer: Nothing in this report should be construed as a solicitation to buy or sell any securities mentioned. Technical Traders Ltd., its owners and the author of this report are not registered broker-dealers or financial advisors. Before investing in any securities, you should consult with your financial advisor and a registered broker-dealer. Never make an investment based solely on what you read in an online or printed report, including this report, especially if the investment involves a small, thinly-traded company that isn’t well known. Technical Traders Ltd. and the author of this report has been paid by Cardiff Energy Corp. In addition, the author owns shares of Cardiff Energy Corp. and would also benefit from volume and price appreciation of its stock. The information provided here within should not be construed as a financial analysis but rather as an advertisement. The author’s views and opinions regarding the companies featured in reports are his own views and are based on information that he has researched independently and has received, which the author assumes to be reliable. Technical Traders Ltd. and the author of this report do not guarantee the accuracy, completeness, or usefulness of any content of this report, nor its fitness for any particular purpose. Lastly, the author does not guarantee that any of the companies mentioned in the reports will perform as expected, and any comparisons made to other companies may not be valid or come into effect.
Chris Vermeulen Archive |
© 2005-2022 http://www.MarketOracle.co.uk - The Market Oracle is a FREE Daily Financial Markets Analysis & Forecasting online publication.