


US Stocks Seem To Be Following Our Predictions – Get Ready
Stock-Markets / Stock Markets 2019 Jul 29, 2019 - 06:49 PM GMTBy: Chris_Vermeulen

 In the first part of this multi-part technology sector research post, we highlighted our previous research and predictive modeling result that suggest the US and global stock markets are poised for a peak/roll-over within the next 30+ days. Our predictive modeling systems and cycle analysis tools are pointing to August 19, 2019, critical inflection date that we believe will become the “breakdown date” for this next big move to the downside.
Part of our effort to help skilled technical traders is to provide research posts, like these, that highlight trade setups and allow our followers to understand the type of trading opportunities that are present for them to consider in the future. We believe the next 30+ days will prove our predictions are accurate and that the US/Global stock markets will roll-over into a new bearish trend – likely breaking downward near August 19, 2019.
With this in mind, Part II will continue to explore trade setups and opportunities related to our belief that the NQ/Technology Sector will become one of the biggest rotations when this move happens.
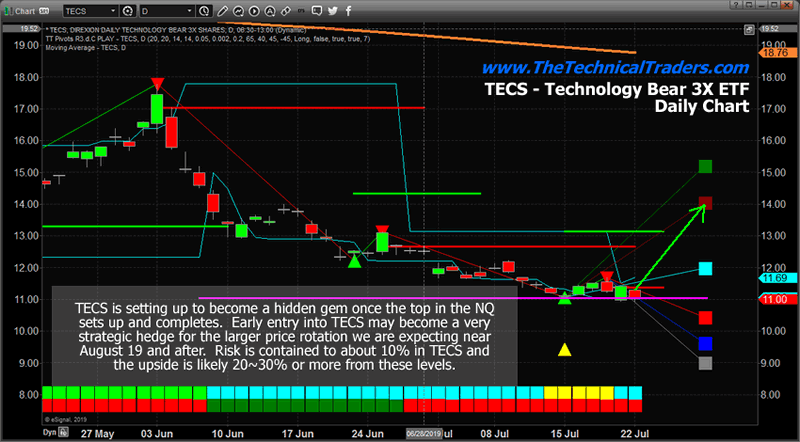
NQ/TECS price prediction
Our downside NQ price prediction supports a hedging trade in TECS for skilled technical traders. If our predictions are accurate, then the risk levels for a strategic trade in TECS are only about 10% to 15% from current price levels and the upside profit potential is 12% to 35% (or more). We are actively seeking an entry price near recent lows in TECS (near $11 or lower) over the next 2+ weeks as we watch the US stock market continue to attempt to push to new highs.
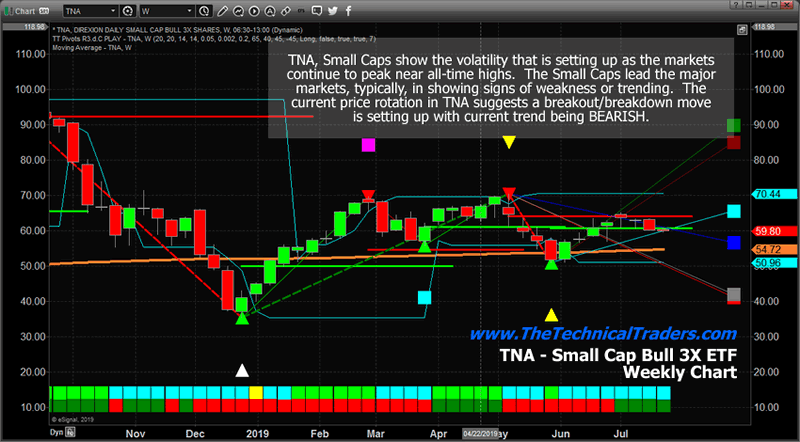
TNA, Small Cap Bull ETF
The TNA, Small Cap Bull ETF, is often a leader for the US major markets. This Weekly chart highlights the weakness that is found in the Small Caps compared to the NQ chart above. While the NQ chart has continued to push higher, the TNA chart has rolled-over and has weakened substantially from the October to December 2018 rotation. It is our belief that the continued price weakness in the Small Caps will provide a leading price confirmation of the US major markets price rotation downward over the next few weeks and months.
We also believe the Transportation Index (TRAN) will lead the markets lower over the next few weeks and months. Skilled traders must learn to search for these market-leading triggers/signals to stay ahead of the next big price swings.
So, within this article, we’ve highlighted three incredible trading opportunities and setups for skilled technical traders. Each one is aligned to a single event that may happen in the future and each one varies in the price level, scale, and scope for different skill levels of traders. The opportunities for these types of trades in 2019 and 2020 keep setting up over and over again. We believe the next 2 to 3 years are going to continue to create incredible opportunities for us as technical traders. You can become a technical trader with us before Aug 1st if you ack now!
There are dozens of great trades setting up right now in preparation for the August 19 price peak/price rotation that we predicted months ago. The markets are setting up for some really big swing trades and we urge all traders/investors to be prepared for these moves by joining my Wealth Building Newsletter
5 other crucial warning signs about the US markets topping and the pending gold and silver bull market
In early June I posted a detailed video explaining in showing the bottoming formation and gold and where to spot the breakout level, I also talked about crude oil reaching it upside target after a double bottom, and I called short term top in the SP 500 index. This was one of my premarket videos for members it gives you a good taste of what you can expect each and every morning before the Opening Bell. Watch Video Here.
I then posted a detailed report talking about where the next bull and bear markets are and how to identify them. This report focused mainly on the SP 500 index and the gold miners index. My charts compared the 2008 market top and bear market along with the 2019 market prices today. See Comparison Charts Here.
On June 26th I posted that silver was likely to pause for a week or two before it took another run up on June 26. This played out perfectly as well and silver is now head up to our first key price target of $17. See Silver Price Cycle and Analysis.
More recently on July 16th, I warned that the next financial crisis (bear market) was scary close, possibly just a couple weeks away. The charts I posted will make you really start to worry. See Scary Bear Market Setup Charts.
CONCLUDING THOUGHTS:
In short, you should be starting to get a feel of where stocks are headed along with precious metals for the next 8-24 months. The next step is knowing when and what to buy and sell as these turning points take place, and this is the hard part. If you want someone to guide you through the next 12-24 months complete with detailed market analysis and trade alerts (entry, targets and exit price levels) join my ETF Trading Newsletter.
Be prepared for these incredible price swings before they happen and learn how you can identify and trade these fantastic trading opportunities in 2019, 2020, and beyond with our Wealth Building & Global Financial Reset Newsletter. You won’t want to miss this big move, folks. As you can see from our research, everything has been setting up for this move for many months – most traders/investors have simply not been looking for it.
Join me with a 1 or 2-year subscription to lock in the lowest rate possible and ride my coattails as I navigate these financial market and build wealth while others lose nearly everything they own during the next financial crisis.
As a technical analysis and trader since 1997, I have been through a few bull/bear market cycles. I believe I have a good pulse on the market and timing key turning points for both short-term swing trading and long-term investment capital. The opportunities are massive/life-changing if handled properly.
FREE GOLD & SILVER WITH MEMBERSHIPS
So kill two birds with one stone and subscribe for two years to get your FREE PRECIOUS METAL and get enough trades to profit through the next metals bull market and financial crisis!
Chris Vermeulen
www.TheTechnicalTraders.com
Chris Vermeulen has been involved in the markets since 1997 and is the founder of Technical Traders Ltd. He is an internationally recognized technical analyst, trader, and is the author of the book: 7 Steps to Win With Logic
Through years of research, trading and helping individual traders around the world. He learned that many traders have great trading ideas, but they lack one thing, they struggle to execute trades in a systematic way for consistent results. Chris helps educate traders with a three-hour video course that can change your trading results for the better.
His mission is to help his clients boost their trading performance while reducing market exposure and portfolio volatility.
He is a regular speaker on HoweStreet.com, and the FinancialSurvivorNetwork radio shows. Chris was also featured on the cover of AmalgaTrader Magazine, and contributes articles to several leading financial hubs like MarketOracle.co.uk
Disclaimer: Nothing in this report should be construed as a solicitation to buy or sell any securities mentioned. Technical Traders Ltd., its owners and the author of this report are not registered broker-dealers or financial advisors. Before investing in any securities, you should consult with your financial advisor and a registered broker-dealer. Never make an investment based solely on what you read in an online or printed report, including this report, especially if the investment involves a small, thinly-traded company that isn’t well known. Technical Traders Ltd. and the author of this report has been paid by Cardiff Energy Corp. In addition, the author owns shares of Cardiff Energy Corp. and would also benefit from volume and price appreciation of its stock. The information provided here within should not be construed as a financial analysis but rather as an advertisement. The author’s views and opinions regarding the companies featured in reports are his own views and are based on information that he has researched independently and has received, which the author assumes to be reliable. Technical Traders Ltd. and the author of this report do not guarantee the accuracy, completeness, or usefulness of any content of this report, nor its fitness for any particular purpose. Lastly, the author does not guarantee that any of the companies mentioned in the reports will perform as expected, and any comparisons made to other companies may not be valid or come into effect.
Chris Vermeulen Archive |
© 2005-2022 http://www.MarketOracle.co.uk - The Market Oracle is a FREE Daily Financial Markets Analysis & Forecasting online publication.