


Silver Eyes Fourth Quarter Rebound
Commodities / Gold & Silver 2019 Oct 04, 2019 - 08:38 AM GMTBy: MoneyMetals

 Precious metals markets enter the often favorable fourth quarter trading season with the potential to reinvigorate their major uptrends.
Despite posting impressive gains in the third quarter, gold and (especially) silver finished it on a downbeat note.
On Monday, sellers smashed silver spot prices down 3.6% to test the $17.00/oz. level.
The disappointing finish to the month and the quarter does raise the possibility that momentum selling could continue to drag prices lower in the near term. However, quarter-end profit taking and portfolio shuffling by institutional futures traders could also work in favor of an immediate price bounce.
The big question is whether silver’s strong breakout this summer to multi-year highs was a fluke… or a prelude to bigger things to come.
At the time, multiple indicators pointed toward it being the real deal – the first big impulsive wave within a larger new cyclical bull market for silver. Price itself is the most important technical indicator, and the silver price had broken out of a long consolidation phase to spike up just shy of $20.00/oz by early September.
The subsequent pullback came as no surprise to our readers. We warned on August 29th, with silver rallying above $18.50/oz, that it “may finally be due for a pause, if not a pullback.” We noted that a gauge of weekly upside momentum was “in extremely overextended territory.”
Now that some of the overenthusiastic speculators who entered the market at higher prices have been washed out, we suspect that the remaining bulls have strong hands and will tend to be buyers rather than sellers on any further price declines.
Ratio Trade Opportunities in Silver and Platinum
We will be watching the gold:silver ratio closely during days when precious metals markets rally for confirmation that silver is leading.
In a healthy bull market for the metals, silver leads on both the upside and the downside – both rallying and declining more sharply than gold.
As silver prices surged earlier in the year, the gold:silver ratio declined rapidly from a quarter-century high of over 93:1 to as low as 80:1. In September, the ratio spiked back above 86:1 as silver sold off.
The chart of the gold:silver ratio appearing below suggests we could soon see a turn in favor of silver. In recent years, the ratio has tended to key off its 200-day moving average. It ran straight into that line on Monday.
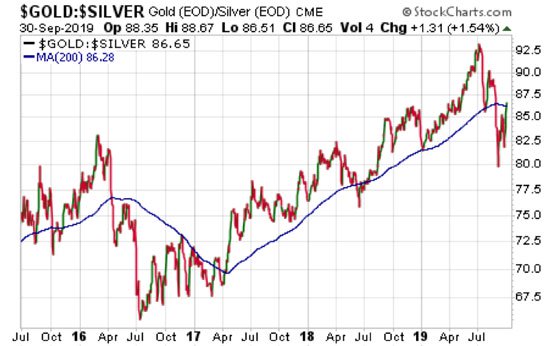
The 200-day moving average is starting to point down for the first time since 2016. That suggests the major trend for the gold:silver ratio is also down – which, again, would be bullish for silver in particular and precious metals in general.
Another ratio that tells an interesting story is that of gold:platinum.
Earlier this year, gold commanded a historically large premium over platinum (1.8:1). Up until the current decade, the norm was for gold to trade at a discount to platinum.
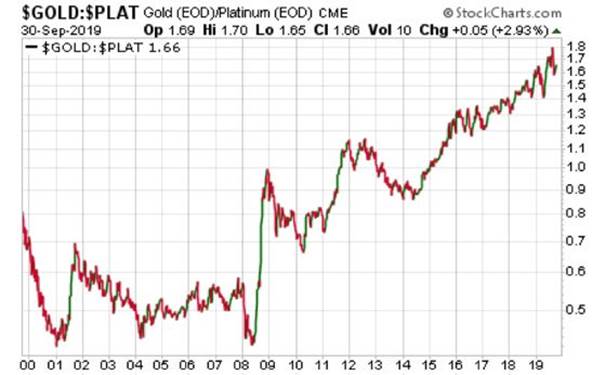
Fundamentally, the platinum market has suffered from softening automotive demand as automakers have favored palladium for use in catalytic converters. Palladium, which historically traded at a discount to platinum, now trades at a premium to both platinum and gold.
At some point, the value proposition offered by platinum should become compelling to both industrial consumers and precious metals investors. But at this particular point, the beaten down metal shows no technical signs of trending higher against either palladium or gold.
The most compelling ratio trade in the metals space at the moment appears to be to favor silver over gold.
Conservative investors will want to still hang on to a core gold position. However, more aggressive investors who are inclined to trade might consider selling gold in exchange for silver.
If the gold:silver ratio trends in favor of silver in the months and years ahead, the magnitude of the move should be more than large enough to offset the transaction costs associated with switching in and out.
For example, if the ratio falls to 32:1 (a level last seen in 2011), then silver would nearly triple in value versus gold. At 32:1, a $1,600/oz gold price would imply $50 silver.
Of course, it’s more likely that gold would show significant nominal appreciation on the way to a 32:1 gold:silver ratio. A $2,500 gold price would imply $78 silver – more than 4.5 times today’s spot silver quote.
These are not price forecasts, but rather just illustrations of potential price scenarios that (among many others) could play out over time. As always, precious metals investors should retain a long-term perspective and be prepared to weather near-term volatility.
Stefan Gleason is President of Money Metals Exchange, the national precious metals company named 2015 "Dealer of the Year" in the United States by an independent global ratings group. A graduate of the University of Florida, Gleason is a seasoned business leader, investor, political strategist, and grassroots activist. Gleason has frequently appeared on national television networks such as CNN, FoxNews, and CNBC, and his writings have appeared in hundreds of publications such as the Wall Street Journal, Detroit News, Washington Times, and National Review.
© 2019 Stefan Gleason - All Rights Reserved
Disclaimer: The above is a matter of opinion provided for general information purposes only and is not intended as investment advice. Information and analysis above are derived from sources and utilising methods believed to be reliable, but we cannot accept responsibility for any losses you may incur as a result of this analysis. Individuals should consult with their personal financial advisors.
© 2005-2022 http://www.MarketOracle.co.uk - The Market Oracle is a FREE Daily Financial Markets Analysis & Forecasting online publication.