


Stock Market & Coronavirus Breakdown Metrics – Where’s The Bottom?
Stock-Markets / Stock Markets 2020 Mar 04, 2020 - 01:52 PM GMTBy: Chris_Vermeulen

The end of February was brutal for traders that were not prepared for the breakdown in the US stock markets. The breakdown in price actually started on February 20th and 21st. Most traders didn’t pay attention to these minor downside price rotations in the Technology sector (NQ) and the Financial sector. The early downside price rotations in key sectors gave traders a bit of a warning that the markets were starting to shift away from the earnings-driven rally that had set up the recent peaks.
The other item that concerned the markets was the spread of the Corona Virus into Italy, Iran and other areas without known contact to areas of the virus origin. Obviously, there had to be some process of contact for the virus to spread – but there are concerns now that the virus could be active within various societies throughout the incubation period and spreading to people in densely populated cities in these areas. The idea of a “super spreader” event becomes very real if societies are not able to identify and contain the sources of these transmissions.
The fear that gripped the markets last week had been telegraphed for many weeks with the news and speculation that China and Asia were going to be hit with much weaker economic data in Q1 of 2020. Almost anyone with a bit of common sense should understand the economic complications associated with quarantining millions of people for well over 30+ days would destroy economic activity in China. Even environmental data (NASA) suggests the Chinese economic activity has collapsed in 2020.
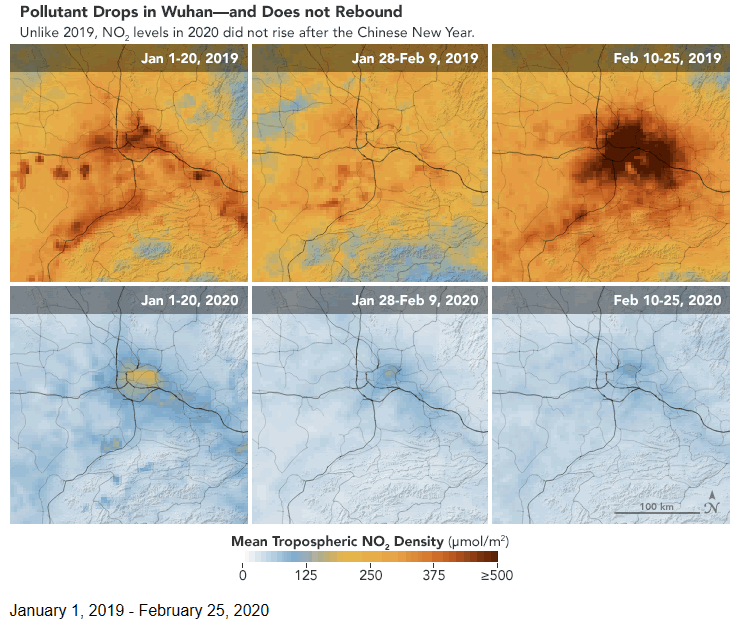
(Source: https://earthobservatory.nasa.gov)
It is time for skilled traders and investors to come to the realization that a Deflationary Recession is very likely given the scale and scope of the Corona Virus spread. Although the numbers pale in comparison to the common Flu/Cold, the economic implications are far more severe. As the virus spreads into the Middle East, Europe and Africa (think Belt Road Initiative) and early signs that it has already spread into parts of South America, one has to begin to wonder if this event could be something similar to Plague or Pandemic events of the past?
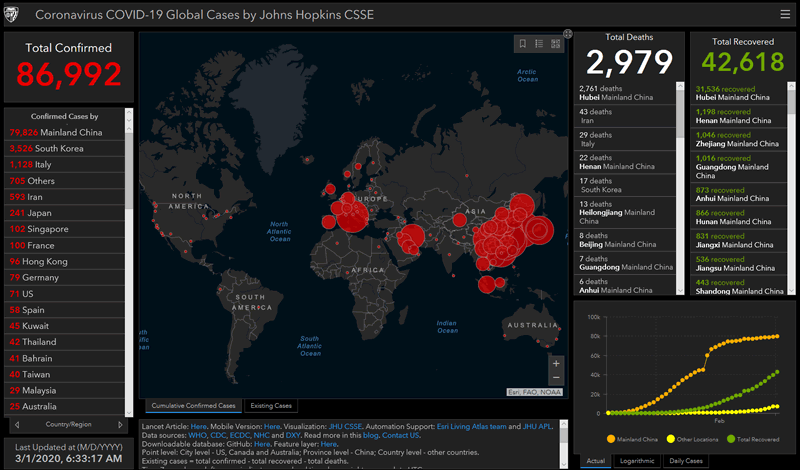
(Source: https://gisanddata.maps.arcgis.com)
As skilled traders, we need to try to stay ahead of these events, attempt to predict where risks and opportunities will arise and work to protect our assets while attempting to trade within these market events. What happens if this event turns into an extended downside price rotation? What happens if, collectively, the global central banks can’t support the markets as consumers globally move away from traditional spending and shopping activities? What are the longer-term implications of this event as it unfolds? Could this Virus event turn into a Global Deflationary Depression?
There are a few positives we need to report originating out of the US and Israel. News of a potential vaccine produced by a Texas firm and an Israeli firm has been announced over the past 10+ days. Both firms believe they will be able to engage in human trials of these vaccines within a few weeks. Our advanced technology and computerized modeling systems allow us to respond to these types of virus events much faster than ever before. If these vaccines are successful and can be distributed in mass throughout the globe, we may see this virus event come to a sudden positive conclusion.
The other good news is that the Corona Virus appears to be far less deadly than even the common Flu or Cold. Currently, the reported numbers are (roughly) 87,000 infected and 3,000 deaths. That results in a 3.4% mortality rate. The 2019 mortality rate for pneumonia and influenza was 6.9% (Source: https://www.cdc.gov/). The reality of the situation on the ground is that we will know more about these data points as we progress further in time. Numbers change as the total scope of the issue is determined.
As skilled traders, our objective is to protect capital and identify opportunities for profits. As horrible as it may seem to look at this global event and try to find ways to profit from it – that is really our main objective. We’ve been getting calls from friends and clients asking us “should I buy airlines and other sectors right now? This seeming like an incredible opportunity to buy into this weakness?”. Our answer is a bit more complicated as we are attempting to predict the future event and we don’t believe the bottom has setup/formed yet. The simple answer is “NO, you should not be buying into this weakness until we know a bottom has setup and risks to the global economy are more settled”.
Still, there are different opinions from institutional and private investors regarding the total scope of this event. UBS recently issued a BUY for “rich clients” to take advantage of this drop in prices in Chinese and Emerging Markets (Source: https://finance.yahoo.com). We don’t agree with this analysis quite yet – unless you have a very deep threshold for risk and potential losses. Our research suggests the bottom will likely complete in May or June of 2020.
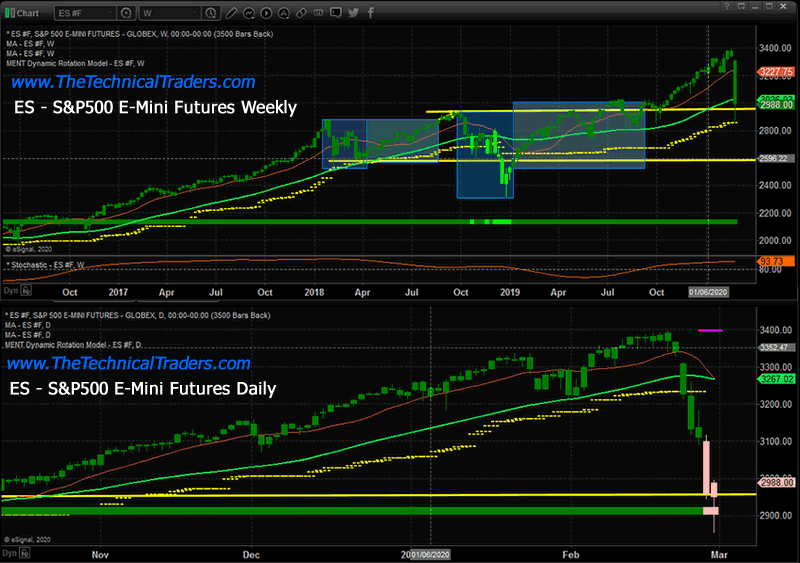
This ES chart highlights the downside rotation in price last week and the fact that our Dynamic Rotation modeling system is still suggesting the Weekly trend has not changed to Bearish from Bullish. The fact is this downside price rotation is still above the YELLOW dashed line which represents trend support. The Daily chart of the ES, below the Weekly chart, shows the Dynamic Rotation modeling system has already changed from a Bullish trend to moderate Bearish trend. Because of this, skilled traders need to immediately protect open long positions and consider adjusting their portfolio allocations in preparation of extended downside price moves.
Our researchers believe the ultimate support level on the ES chart is near the $2590 level. Price may pause near the $2975 level as this level coincides with previous tops in the market and identifies as moderate support. Yet, we believe the ultimate support level is really near the $2590 level and that is the price this downside move will initially target.
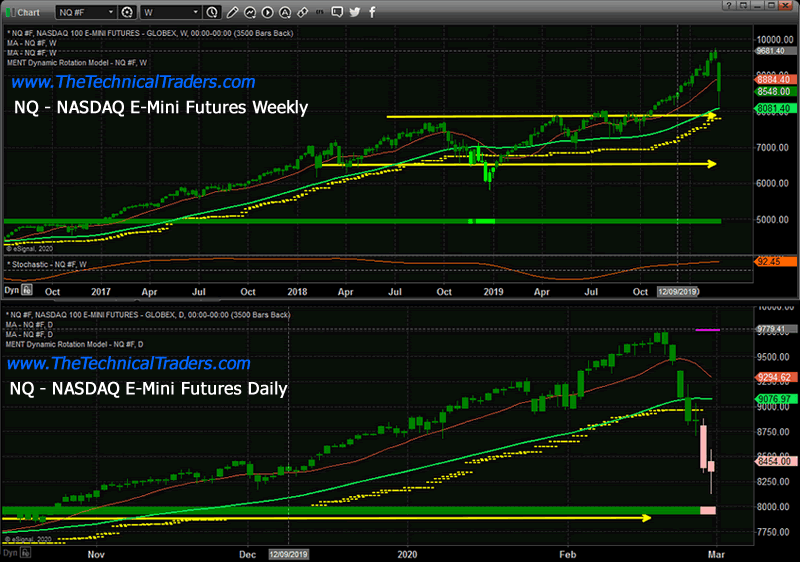
This NQ chart also highlights the immediate downside price rotation in the NASDAQ and how the Weekly chart has yet to confirm any new Bearish price trend. The Weekly chart still shows confirmed bullish price trends and suggests the recent downside price rotation was within volatility ranges. The Daily chart has already changed from a Bullish to moderate Bearish trend. Again, this suggests skilled traders should immediately attempt to lock in profits and prepare for any further downside price trends.
True support on the NQ chart is currently $6575. This suggests the NQ has another 2000 points to fall (-23.5%) before any real price support will be found. Be prepared for this move.
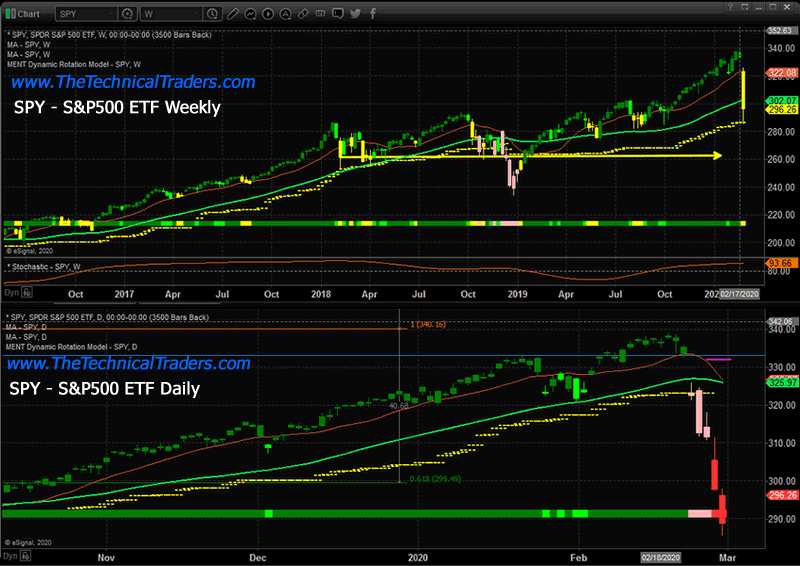
This SPY chart more clearly shows the scope of the downside price rotation. The Weekly chart has already changed from GREEN to YELLOW – indicating a change in rotation price trend from Bullish to NEUTRAL on the Weekly chart. The Daily chart shows a trend change from Bullish to Moderate Bearish (Pink) to BEARISH (Red). This suggests the SPY price reaction has more clearly illustrated the risks of this downside price move and suggests extended downside trending may continue.
Our ultimate support level for the SPY is near $262 – another $35 lower (-11.75%). If these ultimate support levels are reached, the total downside price rotation for all of these charts would total more than -20%. Certainly more than a simple 8~10% correction.
This is why we believe skilled traders need to pay attention to our recent research and understand the total scope and scale of this move. We’ve already been warning our friends and followers of the potential risks setting up in the markets.
February 24, 2020: HAS THE EQUITIES WATERFALL EVENT STARTED OR A BUYING OPPORTUNITY?
February 19, 2020: IS THE TECHNOLOGY SECTOR SETTING UP FOR A CRASH? PART III
We can’t make this warning clear enough for all of you right now – prepare for deeper downside price rotation and prepare for the potential of a Deflationary Recession event over the next 6+ months.
As a technical analysis and trader since 1997, I have been through a few bull/bear market cycles. I believe I have a good pulse on the market and timing key turning points for both short-term swing trading and long-term investment capital. The opportunities are massive/life-changing if handled properly.
As a technical analysis and trader since 1997, I have been through a few bull/bear market cycles. I believe I have a good pulse on the market and timing key turning points for both short-term swing trading and long-term investment capital. The opportunities are massive/life-changing if handled properly.
I urge you visit my ETF Wealth Building Newsletter and if you like what I offer, join me with the 1-year subscription to lock in the lowest rate possible and ride my coattails as I navigate these financial market and build wealth while others lose nearly everything they own during the next financial crisis. Join Now and Get a Free 1oz Silver Bar!
Chris Vermeulen
www.TheTechnicalTraders.com
Chris Vermeulen has been involved in the markets since 1997 and is the founder of Technical Traders Ltd. He is an internationally recognized technical analyst, trader, and is the author of the book: 7 Steps to Win With Logic
Through years of research, trading and helping individual traders around the world. He learned that many traders have great trading ideas, but they lack one thing, they struggle to execute trades in a systematic way for consistent results. Chris helps educate traders with a three-hour video course that can change your trading results for the better.
His mission is to help his clients boost their trading performance while reducing market exposure and portfolio volatility.
He is a regular speaker on HoweStreet.com, and the FinancialSurvivorNetwork radio shows. Chris was also featured on the cover of AmalgaTrader Magazine, and contributes articles to several leading financial hubs like MarketOracle.co.uk
Disclaimer: Nothing in this report should be construed as a solicitation to buy or sell any securities mentioned. Technical Traders Ltd., its owners and the author of this report are not registered broker-dealers or financial advisors. Before investing in any securities, you should consult with your financial advisor and a registered broker-dealer. Never make an investment based solely on what you read in an online or printed report, including this report, especially if the investment involves a small, thinly-traded company that isn’t well known. Technical Traders Ltd. and the author of this report has been paid by Cardiff Energy Corp. In addition, the author owns shares of Cardiff Energy Corp. and would also benefit from volume and price appreciation of its stock. The information provided here within should not be construed as a financial analysis but rather as an advertisement. The author’s views and opinions regarding the companies featured in reports are his own views and are based on information that he has researched independently and has received, which the author assumes to be reliable. Technical Traders Ltd. and the author of this report do not guarantee the accuracy, completeness, or usefulness of any content of this report, nor its fitness for any particular purpose. Lastly, the author does not guarantee that any of the companies mentioned in the reports will perform as expected, and any comparisons made to other companies may not be valid or come into effect.
Chris Vermeulen Archive |
© 2005-2022 http://www.MarketOracle.co.uk - The Market Oracle is a FREE Daily Financial Markets Analysis & Forecasting online publication.