


S&P Stock Index Targeting 400 Bear Market Low
Stock-Markets / Stocks Bear Market Oct 13, 2008 - 10:02 AM GMTBy: Richard_Shaw

 The S&P 500 has experienced price level growth in the 1990's through today (Oct 10) that is substantially greater than the price growth it experienced in the 40 years after 1950.
We've all partied in the growth rates of the last approximate 20 years, but the party may be over.
Is it possible that the index could cumulatively revert to the growth rate channel characteristic of the 1950 to 1990 period? Yes, it is possible, but we don't know if its probable.
With the ongoing growth “handoff” to the developing economies described by El-Erian in his book, “ When Markets Collide: Investment Strategies for the Age of Global Economic Change “; and with the structural problems and changes unfolding in the developed economies, it would not be crazy to consider that the S&P 500 could revert to former, lower price growth rates.
If the index (proxies SPY and IVV) did revert cumulatively to former growth rates, it would be priced generally in the range of less than 900 to more than 400. That would translate roughly to SPY $90 to $40.
The chart below shows the S&P 500 from 1950 in semi-log format and marks the approximate 1950 through 1990 growth channel with red and green boundary lines extended out to today.
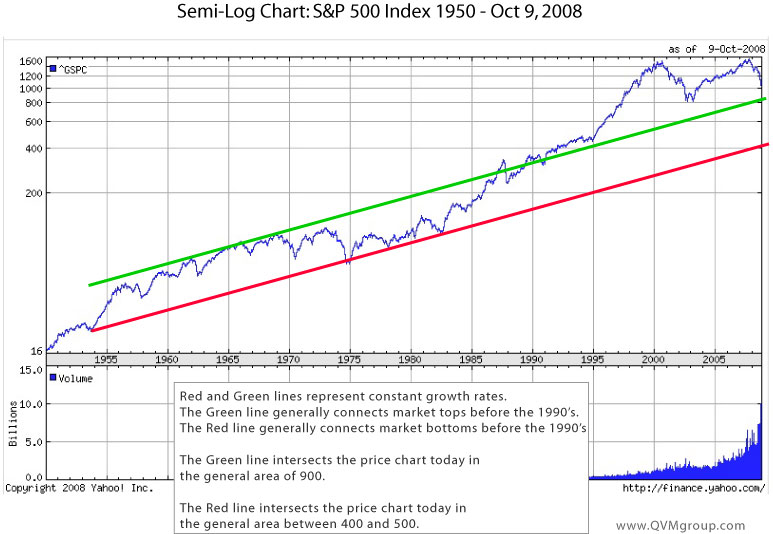
SPY is at $88.50 today. It was over $120 a month ago. It has been over $150. If we revert to the general 1950 to 1990 growth rate channel, we could see SPY trading regularly below $90, and in particularly bad scenarios as low as $40.
Another constant growth rate study we did from 1927 , also suggested a mean reversion possibility to the general 800 to 400 level for the S&P 500 (SPY $80 to $40).
We are not trying to say the sky is falling, and we are not predicting S&P 400. We certainly hope prices don't go that way. However, we are not willing to deny the possibility of an outcome that presents itself so clearly, simply because it is unpleasant and would be quite damaging.
We must consider all reasonable possibilities and their implications for our investment behaviour.
How each investor would deal with that possible growth rate shift would vary greatly, ranging from avoidance through cash or alternative exposure, to hedging, to shorting, to spending it to eliminate the worry.
What do you see as reasonable possibilities? How would you prepare yourself to be aware of growth rates moving to a new lower range? How would you cope?
Post Script (Oct 11):
We published the above comments last night, Oct 10, and must admit we felt no small amount of trepidation about making such a dramatic and potentially unpopular statement. It's tough to be an investment advisor and publish views like that.
The concerns we had were much reduced this morning (Oct 11) when we read the article in the Wall Street Journal by Jason Zweig entitled “ What History Tells Us About the Market “. Here is the except that squares perfectly with our chart-based assertion that S&P 500 could reach the 400 level:
Robert Shiller, professor of finance at Yale University and chief economist for MacroMarkets LLC, tracks what he calls the “Graham P/E,” a measure of market valuation he adapted from an observation Graham made many years ago. The Graham P/E divides the price of major U.S. stocks by their net earnings averaged over the past 10 years, adjusted for inflation. After this week's bloodbath, the Standard & Poor's 500-stock index is priced at 15 times earnings by the Graham-Shiller measure. That is a 25% decline since Sept. 30 alone.
The Graham P/E has not been this low since January 1989; the long-term average in Prof. Shiller's database, which goes back to 1881, is 16.3 times earnings.
But when the stock market moves away from historical norms, it tends to overshoot. The modern low on the Graham P/E was 6.6 in July and August of 1982, and it has sunk below 10 for several long stretches since World War II — most recently, from 1977 through 1984. It would take a bottom of about 600 on the S&P 500 to take the current Graham P/E down to 10. That's roughly a 30% drop from last week's levels; an equivalent drop would take the Dow below 6000.
Could the market really overshoot that far on the downside? “That's a serious possibility, because it's done it before,” says Prof. Shiller. “It strikes me that it might go down a lot more” from current levels.
In order to trade at a Graham P/E as bad as the 1982 low, the S&P 500 would have to fall to roughly 400, more than a 50% slide from where it is today. A similar drop in the Dow would hit bottom somewhere around 4000.
The Schiller approach is based on fundamental analysis and our was based on inferences from charts, but they both got to the same point.
WSJ making an analysis that shows a downside the same as ours doesn't make the worst case scenario any more likely, but it does make our conjecture about what could happen just a bit more sound.
By Richard Shaw
http://www.qvmgroup.com
Richard Shaw leads the QVM team as President of QVM Group. Richard has extensive investment industry experience including serving on the board of directors of two large investment management companies, including Aberdeen Asset Management (listed London Stock Exchange) and as a charter investor and director of Lending Tree ( download short professional profile ). He provides portfolio design and management services to individual and corporate clients. He also edits the QVM investment blog. His writings are generally republished by SeekingAlpha and Reuters and are linked to sites such as Kiplinger and Yahoo Finance and other sites. He is a 1970 graduate of Dartmouth College.
Copyright 2006-2008 by QVM Group LLC All rights reserved.
Disclaimer: The above is a matter of opinion and is not intended as investment advice. Information and analysis above are derived from sources and utilizing methods believed reliable, but we cannot accept responsibility for any trading losses you may incur as a result of this analysis. Do your own due diligence.
Richard Shaw Archive |
© 2005-2022 http://www.MarketOracle.co.uk - The Market Oracle is a FREE Daily Financial Markets Analysis & Forecasting online publication.