


Natural Gas/UNG Stepping GAP Patterns Suggest Pending Upside Breakout
Commodities / Crude Oil Oct 22, 2020 - 07:39 PM GMTBy: Chris_Vermeulen

An upward stepping GAP pattern for UNG and Natural Gas has our research team believing a strong upside price breakout may be pending. We believe the open gap patterns, which are below the current price levels, represent a building momentum based/bottom that has setup in UNG. This pattern, if we are correct, may prompt a big breakout move in the near future.
THREE GAPS PATTERN & MOMENTUM BASE COMPLETE – WHAT NEXT?
These GAP patterns are similar to a Japanese Candlestick pattern called “Three Gaps”. A Three Gaps pattern is typically associated with trending and suggests an exhaustion top may be near. It is represented by three very clear open price gaps in a defined trend (up or down), as can be seen in the chart below.
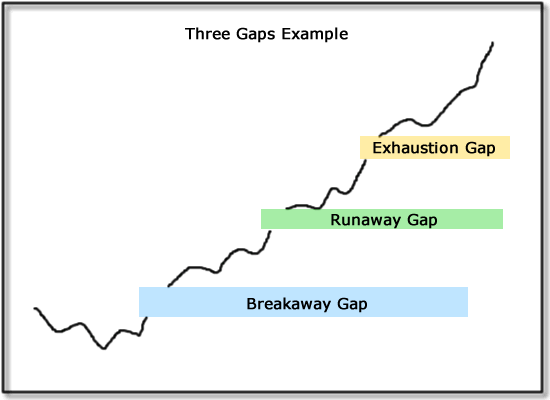
As you can see, a clearly defined trend has extended higher while three clear price gaps have taken place. The first is considered the Breakaway Gap. The second is considered the Runaway Gap, and the last is considered the Exhaustion Gap.
It is fairly easy to understand how these Gaps translate into trends. The first price gap usually represents a strong trend has initiated where price breaks away from previous price ranges. The second gap takes place within the trend and represents trend momentum forcing a price gap to take place. The last gap represents momentum reaching extreme levels, prompting another gap, yet getting closer to an exhaustion top or peak.
Before you continue, be sure to opt-in to our free-market trend signals now so you don’t miss our next special report!
Take a look at the UNG Daily chart below. A very clear series of Three Gaps has completed before the start of September 2020. Then, an Exhaustion Peak rolled price levels lower – reaching just above the $11.00 level. This created a new Momentum Base setup above the Runaway Gap level. Our researchers believe that because the Breakaway and Runaway Gap levels are still “open”, a potentially new upward price trend may setup prompting another set of Three Gaps as price accelerates above the $13 to $14 price level.
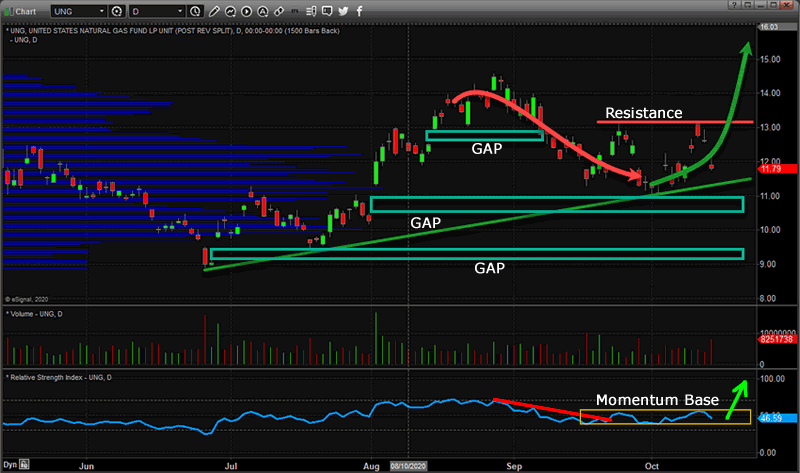
The Exhaustion Gap above was filled by the downward price rotation recently. This suggests the momentum from the Breakaway and Runaway Gaps is still valid, and a new upside price trend may prompt a big rally in Natural Gas and UNG over the next 30+ days.
The Natural Gas Futures Daily chart below shows a very clear price gap that took place on the contract rollover date. This suggests the new month’s price levels represent a perceived higher valuation than the expired month’s contract. Our researchers believe this provides further indication that a bullish rally phase may be pending in Natural Gas.
What becomes more important than the Gap at this time is that the current price levels have allowed the gap to stay OPEN. Thus, the bullish momentum is strong enough at this time to prevent the rollover gap from being CLOSED.
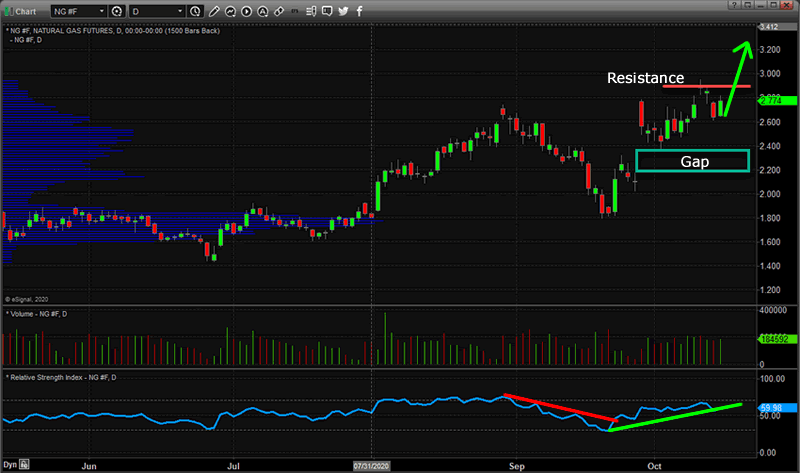
We believe any upside price rally above $2.95 to $3.00 may prompt a breakout rally, possibly creating or prompting a new Runaway Gap pattern, as the price of Natural Gas extends to new Yearly highs. If this rally is similar to the 2018 rally in Natural Gas, price levels above $4.00 to $4.25 are not out of the question.
Skilled technical traders should prepare for one of two options going forward; a breakout above the $3.00 price level in Natural Gas – prompting a new breakout bullish price trend, or a continued downside price rotation where the open gap is retested, which would create a new momentum base near $2.40. This is a chart that technical traders must have on their watch lists right now. The opportunity for a big breakout trend is likely just a few days or weeks away.
As a technical analyst and trader since 1997, I have been through a few bull/bear market cycles in stocks and commodities. I believe I have a good pulse on the market and timing key turning points for investing and short-term swing traders. If you want to learn how to become a better trader and investor, visit www.TheTechnicalTraders.com to learn how we can help you make money with our swing and investing signals. Don’t miss all the incredible trends and trade setups, sign up today.
Chris Vermeulen
www.TheTechnicalTraders.com
Chris Vermeulen has been involved in the markets since 1997 and is the founder of Technical Traders Ltd. He is an internationally recognized technical analyst, trader, and is the author of the book: 7 Steps to Win With Logic
Through years of research, trading and helping individual traders around the world. He learned that many traders have great trading ideas, but they lack one thing, they struggle to execute trades in a systematic way for consistent results. Chris helps educate traders with a three-hour video course that can change your trading results for the better.
His mission is to help his clients boost their trading performance while reducing market exposure and portfolio volatility.
He is a regular speaker on HoweStreet.com, and the FinancialSurvivorNetwork radio shows. Chris was also featured on the cover of AmalgaTrader Magazine, and contributes articles to several leading financial hubs like MarketOracle.co.uk
Disclaimer: Nothing in this report should be construed as a solicitation to buy or sell any securities mentioned. Technical Traders Ltd., its owners and the author of this report are not registered broker-dealers or financial advisors. Before investing in any securities, you should consult with your financial advisor and a registered broker-dealer. Never make an investment based solely on what you read in an online or printed report, including this report, especially if the investment involves a small, thinly-traded company that isn’t well known. Technical Traders Ltd. and the author of this report has been paid by Cardiff Energy Corp. In addition, the author owns shares of Cardiff Energy Corp. and would also benefit from volume and price appreciation of its stock. The information provided here within should not be construed as a financial analysis but rather as an advertisement. The author’s views and opinions regarding the companies featured in reports are his own views and are based on information that he has researched independently and has received, which the author assumes to be reliable. Technical Traders Ltd. and the author of this report do not guarantee the accuracy, completeness, or usefulness of any content of this report, nor its fitness for any particular purpose. Lastly, the author does not guarantee that any of the companies mentioned in the reports will perform as expected, and any comparisons made to other companies may not be valid or come into effect.
Chris Vermeulen Archive |
© 2005-2022 http://www.MarketOracle.co.uk - The Market Oracle is a FREE Daily Financial Markets Analysis & Forecasting online publication.