


Bitcoin Rally Similarities – Is This The Peak?
Currencies / Bitcoin Dec 27, 2020 - 05:51 PM GMTBy: Chris_Vermeulen

The recent rally in Bitcoin is strangely similar to the rally that took place in 2017. Although the range of price throughout the rally is somewhat different, the structure of price throughout the rally phase is very similar. Our researchers believe this similarity suggests a peak may be forming in Bitcoin and the big volume on Monday, December 21, 2020, may have represented a “blow-off peak” in price.
Bitcoin 2017 Peak Structure
The following Weekly Bitcoin chart highlights the three rally phases that took place before the peak level was reached in December 2017. Pay very close attention to the structure you are seeing on this chart and the highlights we’ve made to help you understand how the price structure is being mirrored in the current rally phase.
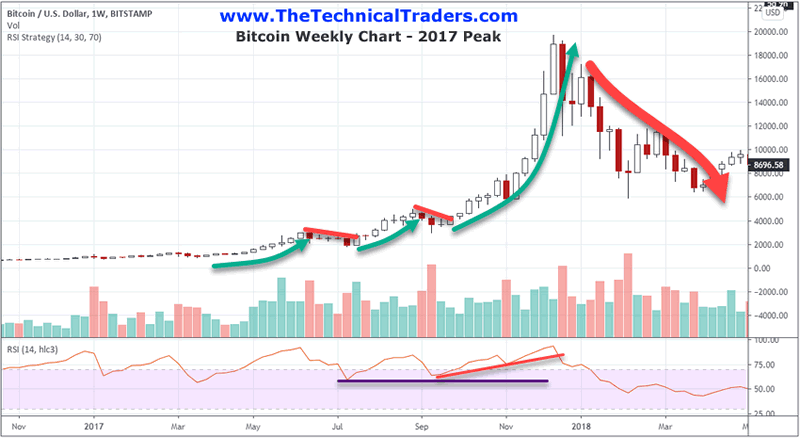
Initially, we saw a $2100 rally in Bitcoin which setup a peak near $2980 that initiated near March 26, 2017 (the first Green Arrow on this chart). After, a mild correction took place which setup a deep trough on the RSI indicator (in the lower pane of this chart). Notice how this deeper low level in RSI set up a momentum base for future trends. Then, a second rally phase pushed Bitcoin prices higher to $4979 – spanning a rally phase of nearly $3050 (the second Green Arrow). This second rally initiated near July 2017 and was followed by another brief consolidation period. Lastly, a breakout rally initiated in October 2017 and reached the peak price level on December 17, 2017 near $19,666.
Next, pay attention to how the end of the rally phase broke below the support channel on the RSI (in RED) and began a excess phase contraction of over $16,000 (-84%) that lasted until December 2018 (near $3135). Are we witnessing a mirror example of this same type of price action in the current Bitcoin rally?
Bitcoin 2020 Peak Structure
This next current Bitcoin Weekly chart, below, highlights the similarities between the 2017 rally and the current rally phase. Although there are minor price range variances related to the size and scope of the different price wave structures, the technical setup is almost identical to the 2017 rally phase.
First, the bottom after the COVID-19 decline setup on March 13, 2020 – only about 14 trading days away from the March 26, 2017 bottom. Next, the initial rally in 2017 consisted of a $2082 (+233%) rally phase whereas the current rally from the March 13 lows consisted of a $6750 rally (+186%) in price. We believe the similarities in the rally percent ranges align close enough to consider both initial rally phases similar.
Next, a moderate price decline setup after that first rally phase which setup a deep RSI low level in July 2020. Remember, in 2017, this first contraction phase ended in July 2017 also – just an odd similarity, or is this something more critical to understand?
Be sure to sign up for our free market trend analysis and signals now so you don’t miss our next special report!
After this contraction phase ended, in July 2020, another rally phase initiated pushing Bitcoin prices higher by about $3225 (+35.75%) which ended in August 2020. In 2017, this second rally phase consisted of a $3061 price rally (+166%) which ended on September 15, 2017. In this instance, we are focused on the similarities in the price ranges of these second rallies and the dates of these rallies. The actual price ranges of these second phase rallies are very similar and the start and end dates of these rallies are strangely similar – even though the end dates are more than 30 days apart.
Lastly, the final rally phase in 2017 initiated near the end of September 2017 and really broke-out in October 12, 2017 – then peaked about 60 days later near December 17, 2017. The current rally phase in 2020 initiated near a low price level on September 8, 2020 and generated a break-out rally on October 20, 2020 – only 8 trading days difference between the 2020 breakout bar and the 2017 breakout bar.
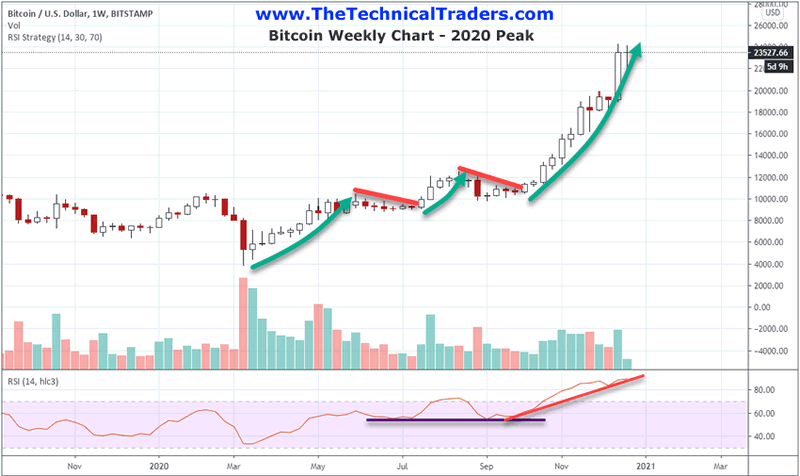
The final phase rally in 2020 has, so far, consisted of a $14,435 price rally (+146%) whereas the 2017 final phase rally consisted of a $16,704 price rally (+553%) and the current 2020 final rally phase has moved $14,435 (+146%). Even though one could argue the price ranges and percent ranges are far enough away from one another to qualify as a “mirror” of the two examples, we feel the similarities are very difficult to dismiss – even if this final phase rally size/scope is 14% smaller than the one in 2017.
Notice how the RSI technical pattern has continued to set up almost exactly like the 2017 rally phase setup – an initial low price level set in July acts as critical support while the subsequent rallies setup an upward sloping support channel – which will eventually be broken. Does this mean that Bitcoin has reached its peak levels – just like in 2017? Are the similarities between the December 17, 2017 price peak and the December 20, 2020 price peak simply an odd curiosity or aligning dates, price phases, and similar structures or is it something more ominous?
Time will tell if our research plays out as we suspect. We are simply pointing out that similarities between the 2017 rally and the current rally are strangely aligning to suggest the current peak price level in Bitcoin may be ending soon. It is a very rare situation where price triggers and trends align so closely to a previous trend that spanned nearly 9 months – but we do understand that these types of price patterns do exist. Some people have built complete trading systems around historical patterns that repeat with a high degree of accuracy over the past 15 to 20+ years. So it is not uncommon for these types of patterns to exist. We find it incredibly interesting to see this type of extended price pattern aligning so closely to the 2017 setup in Bitcoin.
If a future selloff does happen – it will be an incredible example of a “mirror-like” setup taking place on very similar dates nearly 3 years apart. Keep this article in your focus as we move closer to the start of 2021. Remember, the big breakdown in Bitcoin in 2017 first took place on December 22, 2017, then broke down further on January 16,2017. Those might be very important dates in the future.
Our proprietary BAN (Best Asset Now) strategy allows us to know which assets are potentially the best performers in any type of market trend. If you want to learn more about how we can help you with our proprietary tools and strategy then go to www.TheTechnicalTraders.com to learn more. Sign up today to get my daily pre-market analysis of the markets that walks you through the technical indicators of the major asset classes.
Less than two trading sessions before the holidays – stay healthy!
Chris Vermeulen
www.TheTechnicalTraders.com
Chris Vermeulen has been involved in the markets since 1997 and is the founder of Technical Traders Ltd. He is an internationally recognized technical analyst, trader, and is the author of the book: 7 Steps to Win With Logic
Through years of research, trading and helping individual traders around the world. He learned that many traders have great trading ideas, but they lack one thing, they struggle to execute trades in a systematic way for consistent results. Chris helps educate traders with a three-hour video course that can change your trading results for the better.
His mission is to help his clients boost their trading performance while reducing market exposure and portfolio volatility.
He is a regular speaker on HoweStreet.com, and the FinancialSurvivorNetwork radio shows. Chris was also featured on the cover of AmalgaTrader Magazine, and contributes articles to several leading financial hubs like MarketOracle.co.uk
Disclaimer: Nothing in this report should be construed as a solicitation to buy or sell any securities mentioned. Technical Traders Ltd., its owners and the author of this report are not registered broker-dealers or financial advisors. Before investing in any securities, you should consult with your financial advisor and a registered broker-dealer. Never make an investment based solely on what you read in an online or printed report, including this report, especially if the investment involves a small, thinly-traded company that isn’t well known. Technical Traders Ltd. and the author of this report has been paid by Cardiff Energy Corp. In addition, the author owns shares of Cardiff Energy Corp. and would also benefit from volume and price appreciation of its stock. The information provided here within should not be construed as a financial analysis but rather as an advertisement. The author’s views and opinions regarding the companies featured in reports are his own views and are based on information that he has researched independently and has received, which the author assumes to be reliable. Technical Traders Ltd. and the author of this report do not guarantee the accuracy, completeness, or usefulness of any content of this report, nor its fitness for any particular purpose. Lastly, the author does not guarantee that any of the companies mentioned in the reports will perform as expected, and any comparisons made to other companies may not be valid or come into effect.
Chris Vermeulen Archive |
© 2005-2022 http://www.MarketOracle.co.uk - The Market Oracle is a FREE Daily Financial Markets Analysis & Forecasting online publication.