


Stock Market Russell 2000 After Reaching A Trend Channel High Flags Out
Stock-Markets / Stock Market 2021 Jun 05, 2021 - 07:02 PM GMTBy: Chris_Vermeulen

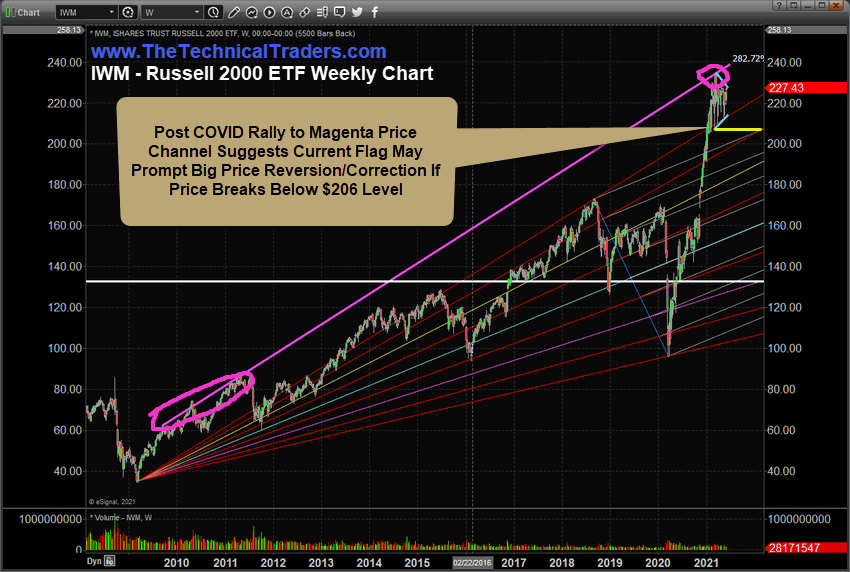
The Russell 2000, which had experienced an incredible 48% upside price rally after the November 2020 US elections, has recently peaked near an upward sloping price channel that originated shortly after the 2010 Housing Crisis bottom. The incredible aspect is that the post-COVID price rally accelerated at such an extreme rate that the current peak level (highlighted by the MAGENTA circle on the chart below) represents an extreme rally phase in price. Unquestionably, at this point, the markets are searching for a new trend and the IWM has consolidated into a sideways Flagging price formation.
I believe global traders are currently searching for new opportunities and have taken the past 45+ days to re-evaluate the extent of the post-COVID rally in the markets. Ironically, the IWM and SPY show similar types of extreme rallies to a previous (2009~2010) price channel high. It is the opinion of my team and I that the markets have entered an over-enthusiastic rally phase to reach these levels and are currently stalling while searching for a new trend.
IWM Flagging Sideways – Watch the $206 Support Level
The current price Flag formation in the IWM chart highlights the extended range for this Flagging price formation. It also highlights the extreme rally phase that took place after the November 2020 elections. At these highs, combined with this Flagging price formation, a moderate price reversion is quite likely if key support is broken in the near future.
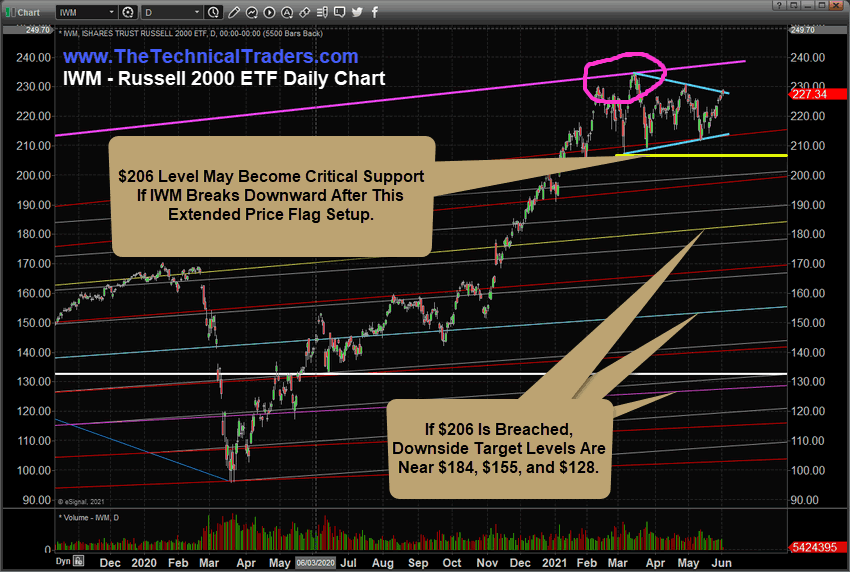
Our research suggests the $206 level on this chart is critical support representing a key price level in the event of a breakdown in price as the Flag formation apexes. Further price targets are available using a type of Fan price extension from the 2009 lows and encompassing the 2018 highs and the 2020 lows. We’ll discuss the downside targets further into this article.
This Daily IWM chart further illustrates the moderate price resistance near the Flag boundaries. Recently, we can see the upper Flag price channel has acted as a strong resistance level as price continues to tighten into the range. IWM opened above the upper Flag price channel this morning and is now trading back below it. This is what we call a “scouting party” – where price attempts to explore new price ranges to see if moderate support or resistance is found outside of these boundaries.
Currently, price has retraced back into the Flag price range and may attempt another move higher if support for another rally attempt continues.
Be sure to sign up for our free market trend analysis and signals now so you don’t miss our next special report!
As we interpret this extended sideways price flag, either the markets will regain their footing and attempt another rally phase (breaking this sideways price channel and attempting to move dramatically higher) or this sideways price channel will prompt a downside breakdown in price – possibly targeting key support near $206.
If a new rally sets up, we believe strong upper resistance will be found near $235~237 (near the MAGENTA extended upper price channel from the 2009 bottom). If a breakdown takes place, the $206 level become a very critical support level (recent lows) which, if broken, could prompt a much deeper price reversion event.
We feel the markets are waiting for a new event or trend to drive new trader/investor participation. After this big rally that followed the November 2020 elections, many traders/investors are anticipating inflation and US Fed moves to curb this extreme rally phase. Possibly, traders/investors are starting to become overly complacent related to the continuous bullish trending phase (especially after Bitcoin and other market sectors have begun a deeper downside price trend).
Time will tell how this Flag formation ends. The NASDAQ and the Russell 2000 will likely be the leaders of any breakout or breakdown in trend. So, what I’d say is to pay attention to how the markets react over the next 15+ days to prepare for the next big trend. One thing we are certain will take place throughout the rest of 2021 and into 2022 – big trends and big volatility. If you have not prepared for this – please consider how the markets will react to any type of breakout or breakdown price event.
For those of you who believe in the power of trading on relative strength, market cycles, and momentum but don’t have the time to do the research every day then my BAN Trader Pro newsletter service does all the work for you with daily pre-market reports, proprietary research, and trade alerts. More frequent or experienced traders have been killing it trading options, ETFs, and stocks using my BAN Hotlist ranking the hottest ETFs, which is updated daily for my premium subscribers. Sign up today!
Have a great day!!
Chris Vermeulen
www.TheTechnicalTraders.com
Chris Vermeulen has been involved in the markets since 1997 and is the founder of Technical Traders Ltd. He is an internationally recognized technical analyst, trader, and is the author of the book: 7 Steps to Win With Logic
Through years of research, trading and helping individual traders around the world. He learned that many traders have great trading ideas, but they lack one thing, they struggle to execute trades in a systematic way for consistent results. Chris helps educate traders with a three-hour video course that can change your trading results for the better.
His mission is to help his clients boost their trading performance while reducing market exposure and portfolio volatility.
He is a regular speaker on HoweStreet.com, and the FinancialSurvivorNetwork radio shows. Chris was also featured on the cover of AmalgaTrader Magazine, and contributes articles to several leading financial hubs like MarketOracle.co.uk
Disclaimer: Nothing in this report should be construed as a solicitation to buy or sell any securities mentioned. Technical Traders Ltd., its owners and the author of this report are not registered broker-dealers or financial advisors. Before investing in any securities, you should consult with your financial advisor and a registered broker-dealer. Never make an investment based solely on what you read in an online or printed report, including this report, especially if the investment involves a small, thinly-traded company that isn’t well known. Technical Traders Ltd. and the author of this report has been paid by Cardiff Energy Corp. In addition, the author owns shares of Cardiff Energy Corp. and would also benefit from volume and price appreciation of its stock. The information provided here within should not be construed as a financial analysis but rather as an advertisement. The author’s views and opinions regarding the companies featured in reports are his own views and are based on information that he has researched independently and has received, which the author assumes to be reliable. Technical Traders Ltd. and the author of this report do not guarantee the accuracy, completeness, or usefulness of any content of this report, nor its fitness for any particular purpose. Lastly, the author does not guarantee that any of the companies mentioned in the reports will perform as expected, and any comparisons made to other companies may not be valid or come into effect.
Chris Vermeulen Archive |
© 2005-2022 http://www.MarketOracle.co.uk - The Market Oracle is a FREE Daily Financial Markets Analysis & Forecasting online publication.