


Gold Needs to Rise Above $838 to Fullfill Annual Minimum Bull Market Target
Commodities / Gold & Silver Nov 17, 2008 - 11:39 AM GMTBy: Ronald_Rosen

 The gold price on the last trading day of 2008 must close higher than the closing gold price on the last trading day of 2007 if the pattern of continuous year to year closing strength is to be maintained. The pattern of the year end closing gold price being higher than the previous years closing gold price has been maintained since the year 2000. The list posted below represents the closing year end gold price for the years 2000 through 2007.
YEAR CLOSING PRICE
2000…………….$273.60
2001…………….$279.00
2002…………….$348.20
2003 ………...….$416.10
2004…………….$438.40
2005…………….$518.90
2006…………….$638.00
2007…………….$838.00
2008…………….$ ??
The current price of gold as of November 14, 2008 is $742.50. There are approximately 26 trading days left in 2008.
$839 or higher is the target for the 2008 closing year end gold price.
GOLD YEARLY CHART WITH YEAR END CLOSING PRICES
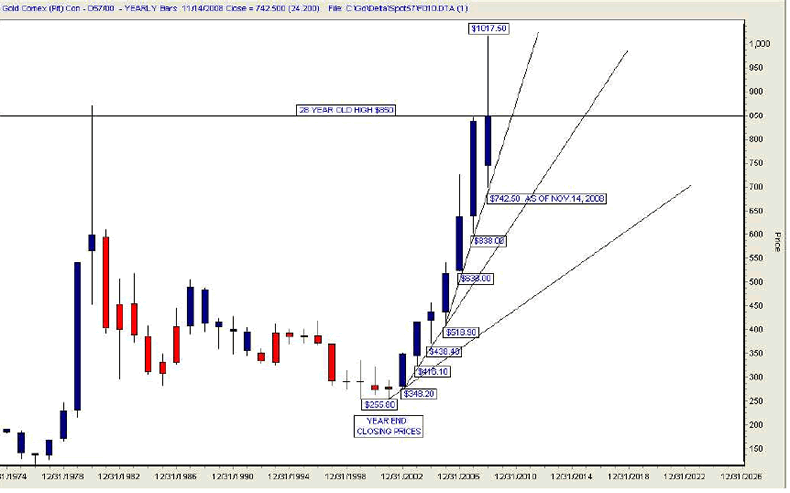
If gold does not exceed last years closing price of $838 by the last day of trading in 2008 it will be sending a signal. This would be the first year since the gold bull market began that a year end closing price failed to close above the previous year’s closing price. It has been and still is my contention that the next important long term high for gold bullion will arrive early in the year 2010.
This chart showing the Delta Long Term turning points is the reason for my confidence. They are amazingly consistent within a predetermined range of time. A turning point number has been entered on this chart directly above and below the appropriate month of arrival for the turning points shown. Once LTD # 3 low has definitely bottomed the next high at LTD # 4 is not due until February 2010.
GOLD MONTHLY CHART
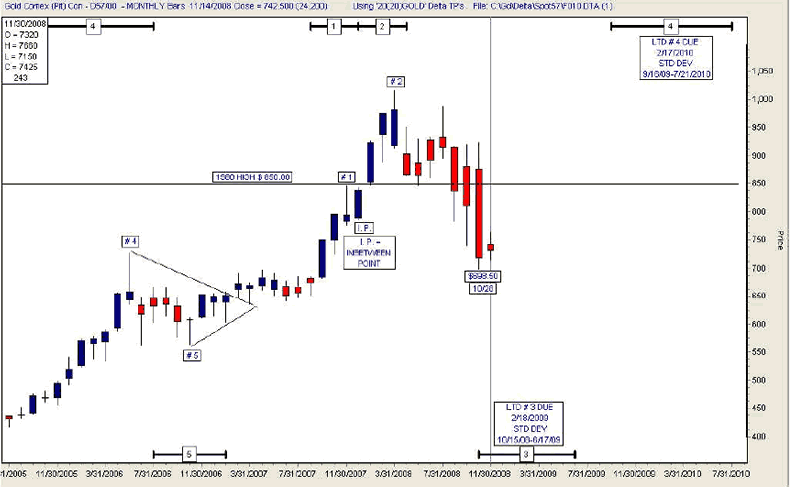
There is a reasonably good probability that gold will close over last years closing high of $838 by the end of this year. The reason is that the Delta Medium # 8 High is due in the month of December 2008. Delta turning points do not provide us with the price at arrival but they do provide us with the approximate time of arrival. That, in and of itself, is amazing.
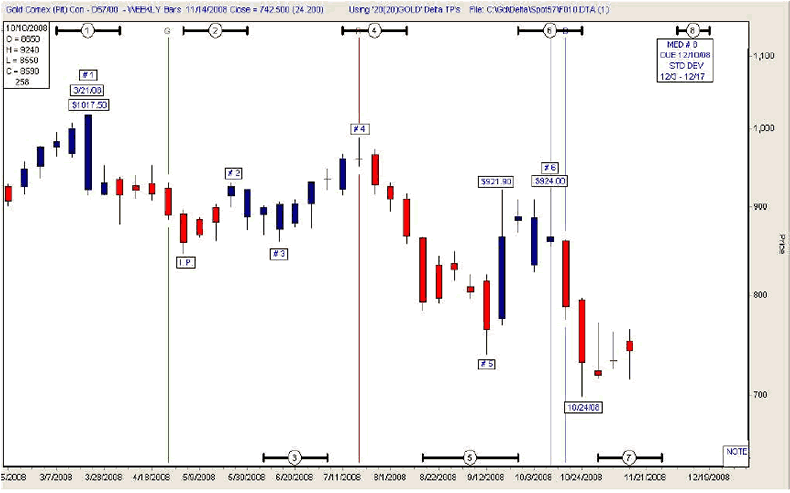
GOLD WEEKLY CHART
“The Delta Phenomenon is the basis of all market movements relative to time. It is the basis of all technical analysis. It is the most basic thing about markets. It is the beginning point. All other methods of technical analysis pale when compared to the fact that there is perfect order in all markets. The Delta order is perfect. That is, it always follows the defined discipline that rules it. I have solved the Delta Phenomenon for many different markets over hundreds of years of data and I have never seen a failure of this order.
Perfect order, however, does not mean that Delta high points and low points are perfectly accurate relative to time. They are not. However, they are close enough to the predicted date that the order is obvious when viewing market action through the Delta perspective. Once one sees this order, he will never be able to perceive markets in the same way again.” Welles Wilder
Subscriptions to the Rosen Market Timing Letter with the Delta Turning Points for gold, silver, stock indices, dollar index, crude oil and many other items are available at: www.wilder-concepts.com/rosenletter.aspx
Ron Rosen and Alistair Gilbert
M I G H T Y I N S P I R I T


Ronald L. Rosen served in the U.S.Navy, with two combat tours Korean War. He later graduated from New York University and became a Registered Representative, stock and commodity broker with Carl M. Loeb, Rhodes & Co. and then Carter, Berlind and Weill. He retired to become private investor and is a director of the Delta Society International
Disclaimer: The contents of this letter represent the opinions of Ronald L. Rosen and Alistair Gilbert Nothing contained herein is intended as investment advice or recommendations for specific investment decisions, and you should not rely on it as such. Ronald L. Rosen and Alistair Gilbert are not registered investment advisors. Information and analysis above are derived from sources and using methods believed to be reliable, but Ronald L. Rosen and Alistair Gilbert cannot accept responsibility for any trading losses you may incur as a result of your reliance on this analysis and will not be held liable for the consequence of reliance upon any opinion or statement contained herein or any omission. Individuals should consult with their broker and personal financial advisors before engaging in any trading activities. Do your own due diligence regarding personal investment decisions.
Ronald Rosen Archive |
© 2005-2022 http://www.MarketOracle.co.uk - The Market Oracle is a FREE Daily Financial Markets Analysis & Forecasting online publication.
Comments
|
Chis
17 Nov 08, 19:01 |
Gold target 838???
Why does the price at the end of the year mean anything more than on any other day of the year... 'it will be sending a signal'?? |