


Credit Crisis Watch- Banking Sector Distrust Remains High
Interest-Rates / Credit Crisis 2008 Dec 09, 2008 - 10:07 AM GMT

 In order to gauge the progress being made to unclog credit markets and restore confidence in the world's financial system, I monitor a range of financial spreads and other measures. By perusing these, as summarised in this “Credit Crisis Watch” review, one can ascertain to what extent the various central bank liquidity facilities and capital injections are having the desired effect.
First up is the LIBOR rate. This is the interest rate that banks charge each other for one-month, three-month, six-month and one-year loans. LIBOR is an acronym for “London InterBank Offered Rate” and is the rate charged by London banks, and which is then published and used as the benchmark for banks' rates around the world.
After having peaked on October 10 at 4.82%, the three-month dollar LIBOR rate declined sharply to 2.13% on November 12, but the healing process has since been moving sideways with the current rate at 2.19%. LIBOR is therefore trading at 119 basis points above the Fed's target rate of 1.0%, compared with 43 basis points at the start of the year.
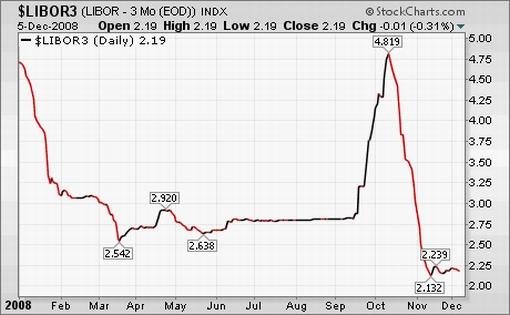
Source: StockCharts.com
Importantly, the US three-month Treasury Bills are trading at a “non-existent” 0.015%, indicating that liquidity is still being hoarded by risk-averse investors.
US three-month Treasury Bill yield
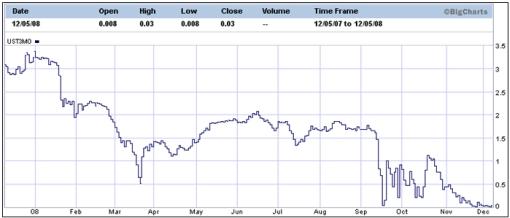
Source: The Wall Street Journal
The TED spread (i.e. three-month dollar LIBOR less three-month Treasury Bills) is a measure of perceived credit risk in the economy. This is because T-bills are considered risk-free while LIBOR reflects the credit risk of lending to commercial banks. An increase in the TED spread is a sign that lenders believe the risk of default on interbank loans (also known as counterparty risk) is increasing. On the other hand, when the risk of bank defaults is considered to be decreasing, the TED spread narrows.
Since the TED spread's peak of 4.65% on October 10 the measure has eased to 1.75%, but has since widened to 2.18%.
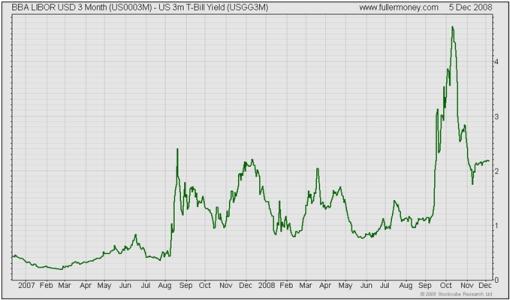
Source: Fullermoney
The difference between the LIBOR rate and the overnight index swap (OIS) rate is another measure of credit market stress.
When the LIBOR-OIS spread is increasing, it indicates that banks believe the other banks they are lending to have a higher risk of defaulting on the loans so they are charging a higher interest rate to offset this risk. The opposite applies to a narrowing LIBOR-OIS spread.
The movement in the LIBOR-OIS spread over the past few weeks is similar to the TED spread and shows that credit markets are still not functioning properly.
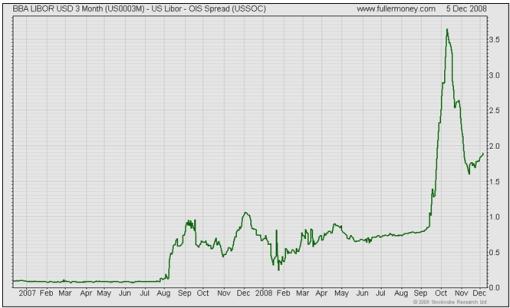
Source: Fullermoney
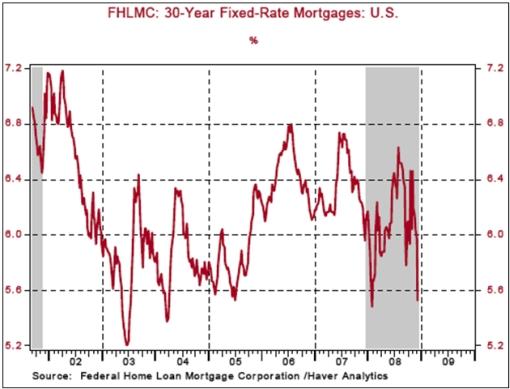
Fed actions to buy up to $500 billion of mortgage securities backed by Fannie Mae, Freddie Mac and Federal Home Loan Banks and purchase up to $100 billion of debt issued by these agencies have resulted in a sharp drop in mortgage rates. The 30-year fixed-rate mortgage averaged 5.53% for the week ended December 5, down from 5.97% the previous week following a high of 6.36% for the week ended October 31. This is certainly a move in the right direction.
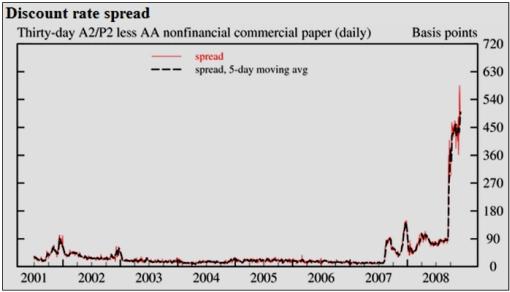
As far as commercial paper is concerned, the A2P2 spread measures the difference between A2/P2 (low quality) and AA (high quality) 30-day non-financial commercial paper. The spread has kicked up from 4.27% a week ago to its record high of 4.83%, indicating a crisis environment.
Source: Federal Reserve Release - Commercial Paper
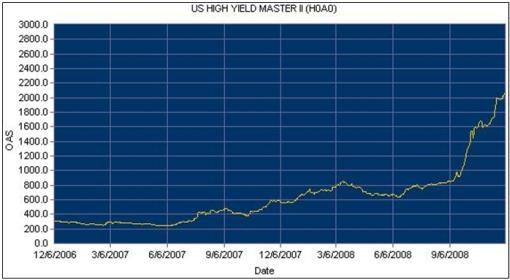
Similarly, junk bond yields continue to rise in parabolic fashion, scaling record highs as shown by the Merrill Lynch US High Yield Index. The spread between high-yield debt and comparable US Treasuries was 2,074 basis points by the close of business on Friday - an increase of more than 750% since bottoming in June 2007. With the US 10-year Treasury Note yield at 2.71%, high-yield borrowers have to pay 23.45% per year to borrow money for a ten-year period. At these rates it will be practically impossible for those companies with less-than-perfect credit status to conduct business profitably.
Source: Merrill Lynch Global Index System
Another indicator worth keeping an eye on is the Barron's Confidence Index. This Index is calculated by dividing the average yield on high-grade bonds by the average yield on intermediate-grade bonds. The discrepancy between the yields is indicative of investor confidence. A declining ratio indicates that investors are demanding a higher premium in yield for increased risk. A slight improvement has taken place over the past week, but hardly of the magnitude to indicate restored confidence in the economy.
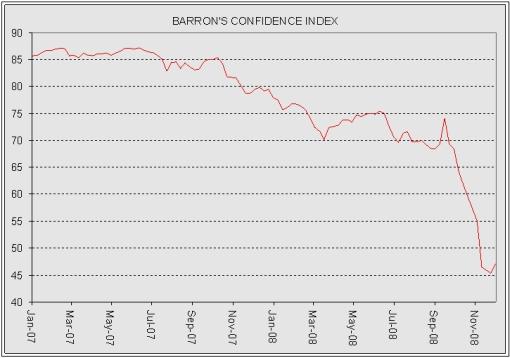
Source: I-Net Bridge
According to Markit , the cost of buying credit insurance for US, European, Japanese and other Asian companies worsened considerably over the past week as shown by the wider spreads (basis points) for the following five-year credit indices (in some instances rising to record levels):
• CDX (North American, investment-grade) Index: down from 233 to 274
• CDX (North America, high-yield) Index: down from 1,376 to 1,461
• Markit iTraxx Europe Index: down from 163 to 216
• Markit iTraxx Europe Crossover Index: down from 869 to 1,094
• Markit iTraxx Japan Index: down from 320 to 375
• Markit iTraxx Asia ex Japan IG Index: down from 360 to 435
• Markit iTraxx Asia ex Japan HY Index: down from 1,218 to 1,300
The graphs of the CDX indices are shown below, with the red line indicating the spreads easing over the past few days.
CDX (North American, investment-grade) Index
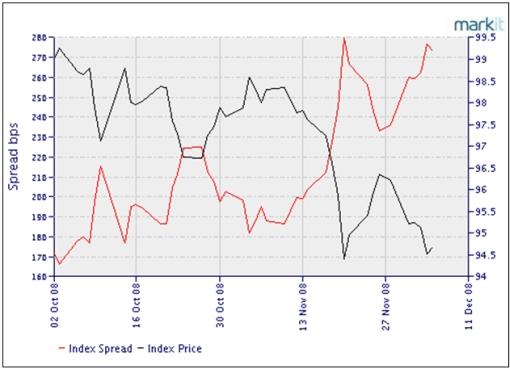
Source: Markit
CDX (North America, high-yield) Index
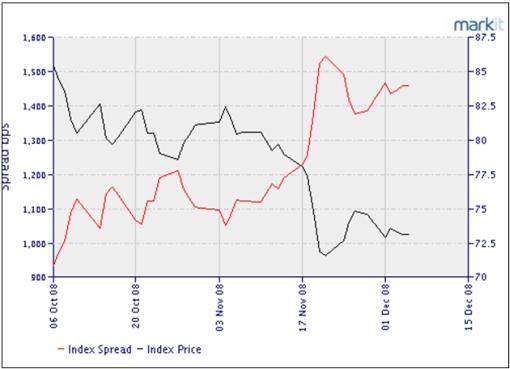
Source: Markit
Quoting Moody's Investors Services, the Financial Times reported that since the Lehman bankruptcy yields on BAA-rated bonds (investment grade) have risen by a third while yields on equivalent US Treasury bonds have dropped by a quarter. “That means the extra yield investors need before they will lend to investment-grade companies has gone from 2.7 to 5.9 percentage points in three months. This is a crisis,” said the article.
Credit markets are therefore bracing for huge defaults. According to Deutsche Bank, “current spreads imply a 50% default rate for high-yield credits and an ‘inconceivable' default rate for investment-grade companies.” They believe government intervention to prevent defaults on such a scale would be inevitable.
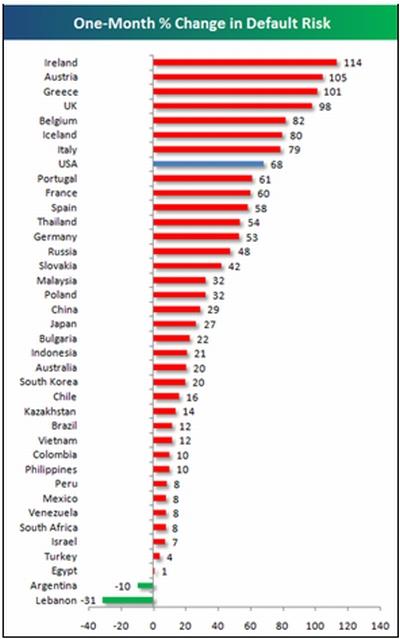
Next, some credit default swap (CDS) statistics, courtesy of Bespoke . Since a month ago the cost of insuring against government bankruptcy through CDSs has risen for all but two countries (Lebanon and Argentina) in Bespoke's list of 38 countries. The table below shows the current (December 4) CDS prices, together with month-ago and start-of-year prices. Argentina, Venezuela, and Iceland have the highest default risk.
Interestingly, Germany, Japan, and France all have lower default risk than the US at the moment. It now costs $60 per year to insure $10,000 against US default for the next five years. “While this may not seem high, it was at $8 earlier in the year, and $36 one month ago,” said Bespoke.
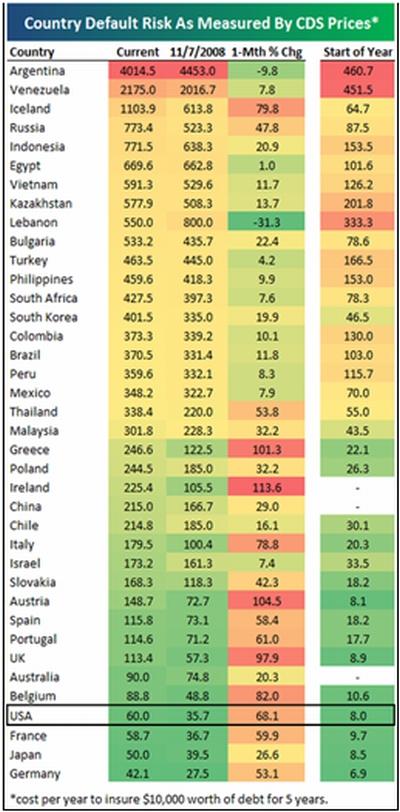
As shown in the table below, Ireland, Austria, Greece, and the UK have seen default risk rise the most over the last month. Notably, the US has risen by 68%.
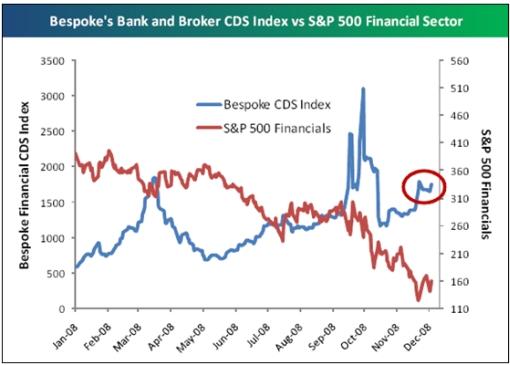
Still on the issue of CDSs, Bespoke points out that even as equity markets and the financial group have begun to show some signs of stability, default risk remains elevated. This is seen from the graph of their Bank and Broker CDS Index that measures default risk for 13 global financial firms. “While default risk is not nearly as high as it was prior to the initial TARP plan, its inability to ease is still cause for concern,” said Bespoke.
In summary, the CDX and iTraxx credit indices, US Treasury Bills and high-yield spreads are still at distressed levels. Some improvement has been seen as a result of central banks' actions, notably the tightening of the TED and LIBOR-OIS spreads, and the decline in mortgage rates.
As long as distrust in the banking sector remains high and banks do not lend to each other, the credit situation will remain tight. Credit spreads need to narrow further to indicate that liquidity is starting to move freely again. Only then will confidence in the financial system start improving and the thawing of credit markets get under way.
Did you enjoy this post? If so, click here to subscribe to updates to Investment Postcards from Cape Town by e-mail.
By Dr Prieur du Plessis
Dr Prieur du Plessis is an investment professional with 25 years' experience in investment research and portfolio management.
More than 1200 of his articles on investment-related topics have been published in various regular newspaper, journal and Internet columns (including his blog, Investment Postcards from Cape Town : www.investmentpostcards.com ). He has also published a book, Financial Basics: Investment.
Prieur is chairman and principal shareholder of South African-based Plexus Asset Management , which he founded in 1995. The group conducts investment management, investment consulting, private equity and real estate activities in South Africa and other African countries.
Plexus is the South African partner of John Mauldin , Dallas-based author of the popular Thoughts from the Frontline newsletter, and also has an exclusive licensing agreement with California-based Research Affiliates for managing and distributing its enhanced Fundamental Index™ methodology in the Pan-African area.
Prieur is 53 years old and live with his wife, television producer and presenter Isabel Verwey, and two children in Cape Town , South Africa . His leisure activities include long-distance running, traveling, reading and motor-cycling.
Copyright © 2008 by Prieur du Plessis - All rights reserved.
Disclaimer: The above is a matter of opinion and is not intended as investment advice. Information and analysis above are derived from sources and utilizing methods believed reliable, but we cannot accept responsibility for any trading losses you may incur as a result of this analysis. Do your own due diligence.
Prieur du Plessis Archive |
© 2005-2022 http://www.MarketOracle.co.uk - The Market Oracle is a FREE Daily Financial Markets Analysis & Forecasting online publication.