


Gold and Stock Markets Volume and Time Series Analysis
Stock-Markets / Investing 2009 Jan 09, 2009 - 08:57 AM GMTBy: Brian_Bloom

 There are those who are arguing that the equity markets are due for a bounce – maybe even an upward surge in prices. Some are very seasoned analysts who have decades of experience under their belts. They may be right, but this analyst has been struck by the relative lack of emphasis by these bullish analysts on the issues of volume and cyclical timing.
Let’s have a look at the chart below – of GLD – to get a better understanding of what I have in mind (courtesy bigcharts.com):
The reader’s attention is drawn to the bottom right hand corner of the volume section of the chart below. Note how the most recent volume spike was to a level of around 10 million shares when the price rose to above 85 (from around 82) whereas the immediately preceding volume spike was to a level of around 20 million shares. When the 20 million odd shares changed hands, the price also spiked up to about 85 (that time from below 80). Also note that the volume spike before that – the one that culminated at around 30 million shares – coincided with a bottoming of the price at around 70.
What might all this mean?
- The latter high volume (30 million shares) was probably caused by an exhaustive surge of selling pressure which accompanied the price bottoming at 70. Note that this selling pressure was weaker than that which accompanied the spike in volume to 60 million shares- where the price bottomed at above 70. This “non confirmation” in volume was a sign that the latent selling pressure might have been exhausted.
- The subsequent price rise to 85 was probably caused by buying pressure as 20 million shares changed hands
- Unfortunately, the latest price rise to above 85, when volume fell to 10 million, was probably caused by an absence of selling pressure as opposed to a presence of buying pressure. This represents a clear warning to traders: Caution! In the absence of buying pressure (VOLUME) this latest price rise might be a bull trap.
Readers should view this warning in context of the series of three falling tops in price from the peak of 100; and also in context of the expiry of the December Gold futures contracts on Comex. This latter “cyclical” event (which was accompanied by a backwardation in the gold price) was expected to give rise to a surge of demand for physical gold as an increasing proportion of purchasers of buy contracts was expected to demand physical delivery rather than be prepared to “roll-over” their contracts.
That this expectation did not materialize may well have been a consequence of the activities of JP Morgan, whose naked short contracts have apparently been exploding in VOLUME as that organization has sought to suppress the gold price on behalf of the Financial Authorities. (See: http://news.goldseek.com/GoldSeek/1230678365.php ). Logically, if there is an increasing volume of buyers demanding physical delivery but this increasing volume does not translate to an increasing percentage of the total volume, then the Comex system might somehow be able to muddle through – which, indeed, it has demonstrably managed to do.
It follows that with the absence of accompanying buying pressure in GLD (volume), and with the passing of the critical cyclical end date without incident, future buying pressure on GLD may abate for the time being. (Readers should note that I am using GLD as a proxy for Gold Bullion in my argument).
Interim Conclusion
By focusing on issues of volume and cyclical timing it becomes apparent that the financial authorities have managed to avert the anticipated (by gold bugs) crisis in the gold markets – for the time being. By implication, it is conceivably possible that they have also managed to avert a broader financial crisis – for the time being.
By way of validation – and before moving on to have a look at the broader equity markets – let’s have a look at the Bullion price charts. Do they confirm this view that upward pressure on the gold price might abate for the time being?
The following is a daily price chart of the gold price – courtesy decisionpoint.com
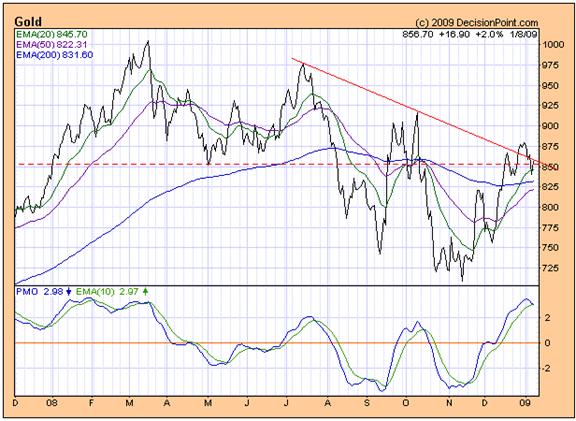
Hmm! Note the bullish non-confirmations of rising bottoms and rising tops on the PMO chart and falling bottoms and falling tops on the price chart. The only bearish sign on this particular chart is that the PMO looks moderately overbought. However, from this analyst’s perspective, even though the price of gold might pull back from this point, there seems to be a strong possibility that, on its next move upwards, the move could give rise to an upward penetration of the falling trend line. The timing of this event is not possible to forecast from this chart, but the run-up to the end of the next Comex settlement cycle at end March may offer a clue. What we will need to do is monitor volume on GLD – to see if there is a build up of buying pressure that pushes prices to higher levels.
Another bullish sign in the gold universe is the chart of the ratio of the gold share index to the gold price, which is best seen in the Point and Figure chart below (courtesy stockcharts.com)
Note how the ratio has recently penetrated above the falling red trend line; and more strongly than at any time since 2003. The market is telling us that it is expecting the gold price to start rising again in the foreseeable future.
So, this begs the question as to whether the authorities (Federal Reserve, Establishment, call them what you will) will be able to orchestrate an outcome which is in alignment with their objectives.
The short answer to this question is that they haven’t got a snowball’s hope in hell, because right now they are trying to control forces which are infinitely greater than they can muster – but let’s focus on that which will more immediately impact on your and my interests. Will the equity markets rise from this point and should we be doing anything about it?
The chart below (courtesy dshort.com) was sent to me by a friend. It is current to December 31st 2008.
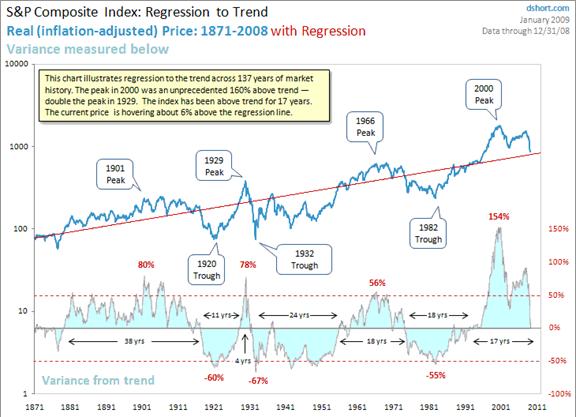
Clearly, the inflation adjusted S&P index is approaching its regression line and, arguably, it might very well bounce upwards before it keeps heading southwards. But history shows that when the price strays too far from its regression line it’s only a matter of TIME before the price reverts and finally penetrates the regression line as the cycle unfolds.
Right now the trend is bearish (falling tops and bottoms) and anyone who is predisposed to argue against that fact is very likely looking at the world through a different lens – probably much shorter term. What this analyst is seeing (on the bottom oscillator section of the chart) is an extraordinary positive deviation from the regression line (150% vs historical 50%) which deviation is unwinding and which still needs to be fully unwound on the downside before we can turn bullish. Typically, a full unwinding will be evidenced by an equal and opposite reaction as the oscillator heads for the minus 150% target. Can the Establishment Elite control that? Well, let’s put it this way: Can bacteria “control” the host organism? There are only two possible outcomes to a virulent bacteria infection: Either the bacteria is eradicated by the antibodies of the host, or the host expires – along with the bacteria. So let’s not waste time or mind space worrying about irrelevancies. I’m betting that the antibodies will move, naturally and effortlessly, to eradicate the bacteria. If I’m wrong then we’re all of us dead anyway, bacteria included.
My preference – rather than occupy my valuable mind space with unproductive thoughts – is to look at the short term chart, courtesy decisionpoint.com.
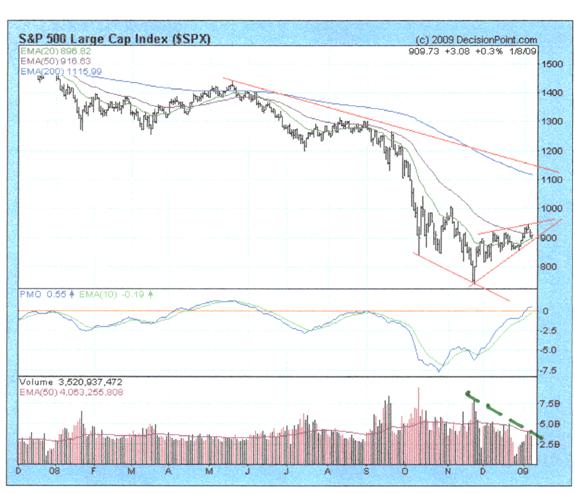
Note the decreasing VOLUME (downward pointing dashed green trend line) even as the price has been rising within the confines of a redrawn wedge formation. This is undoubtedly bearish – given that rising price on falling volume flows from an abatement of selling pressure rather than a presence of buying pressure.
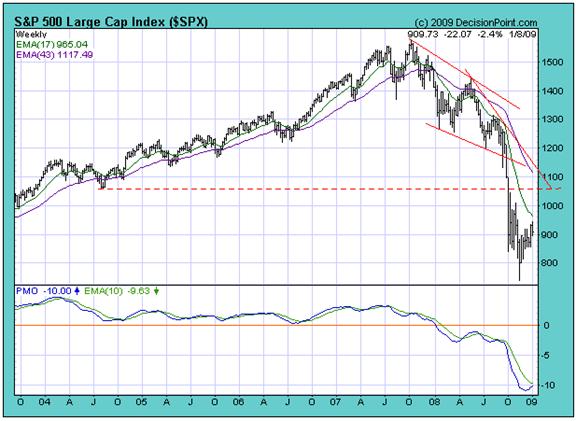
But how can this be? you ask. If we look at the weekly chart of the $SPX we see that it is heavily oversold and the PMO looks like it wants to give a buy signal!
The answer lies in “Time”.
Not half an hour ago I fielded a phone call from an associate within the banking industry in Australia. He informed me that, notwithstanding the fact that the Australian Reserve Bank is not expected to reduce interest rates until February, the banks are moving to reduce the interest rates they pay to depositors of which I am one. What appears to be happening is that the propensity of consumers to save is rising, and this is translating into a flood of savings into the banks. The flip side is that if consumers are saving more they are very likely spending less. This is being borne out by retail numbers. At retail level – unlike the USA and the UK - Australia experienced a reasonable Christmas trading season. However, since the beginning of January there has been a marked contraction of spending within the Australian economy. The velocity of money is slowing and the banks are wallowing in money. When supply (of money) exceeds demand, price falls.
Conclusion
It would appear that the authorities have been attempting to postpone the recession for so long now that the world has been living on time which has been borrowed from the future – and that the future has finally and inexorably morphed to become the present. The time has come when the piper, hand outstretched, is demanding payment. Cash only please. No cheques or promissory notes.
This analyst is prepared to stick his neck out where more cautious men might be more circumspect. I do not like the look of that rising wedge in context of the falling volume, and I am conscious of the fact that, in all of nature, to every action there is an equal and opposite reaction. The 150% positive deviation from the regression line needs to be unwound. My expectation is that, at best, the oversold markets may work through their oversold positions whilst travelling sideways. At worst, we might be facing a collapse in equity prices sooner rather than later. Either way, this is not the time to be invested in equities unless they are special situations.
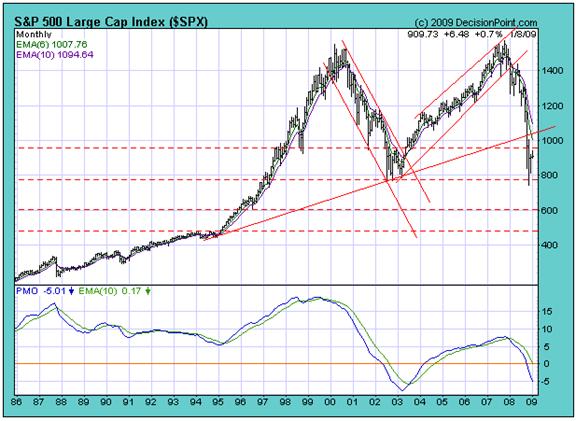
The problem is that if the rising wedge is penetrated on the downside, the Standard and Poor Industrial Index may fall to below 800. If it does that then according to the monthly chart below, it could continue falling to 600 – and maybe even to 400.
Overall Conclusion
"When pride cometh, then cometh shame: but with the lowly is
wisdom."
Proverbs 11:2, KJV
Alternatively:
"Pride goeth before destruction, and an haughty spirit
before a fall. Better it is to be of an humble spirit with
the lowly, than to divide the spoil with the proud."
Proverbs 16:18-19, KJV
There is no place for arrogance in human affairs. The Establishment will very likely be swatted aside like an irritating gnat by the pent up natural forces which drive the economy, amongst other human affairs.
Authors Note
The clear way forward is to focus on facilitating wealth generating activities at grass roots level. John Maynard Keynes got it wrong and many mainstream economists just don’t see that. Yes, spending on infrastructure creates jobs, but the momentum of job creation cannot be sustained without rolling waves of wealth generating activity. At the coalface, without entrepreneurially driven wealth generating activity, there can be no economy for the Establishment or anyone else to control. The megalomaniacal Establishment cannot have its cake and eat it. It is irrational to expect that you can reduce the populace to unthinking drones and that out of this pool of drones will emerge a phalanx of competent entrepreneurs. At the end of the day, it takes more than a high IQ to make you smart. You also need to be possessed of common sense.
By Brian Bloom
Beyond Neanderthal is a novel with a light hearted and entertaining fictional storyline; and with carefully researched, fact based themes. In Chapter 1 (written over a year ago) the current financial turmoil is anticipated. The rest of the 430 page novel focuses on the probable causes of this turmoil and what we might do to dig ourselves out of the quagmire we now find ourselves in. The core issue is “energy”, and the story leads the reader step-by-step on one possible path which might point a way forward. Gold plays a pivotal role in our future – not as a currency, but as a commodity with unique physical characteristics that can be harnessed to humanity's benefit. Until the current market collapse, there would have been many who questioned the validity of the arguments in Beyond Neanderthal. Now the evidence is too stark to ignore. This is a book that needs to be read by large numbers of people to make a difference. It can be ordered over the internet via www.beyondneanderthal.com
Copyright © 2008 Brian Bloom - All Rights Reserved
Disclaimer: The above is a matter of opinion provided for general information purposes only and is not intended as investment advice. Information and analysis above are derived from sources and utilising methods believed to be reliable, but we cannot accept responsibility for any losses you may incur as a result of this analysis. Individuals should consult with their personal financial advisors.
Brian Bloom Archive |
© 2005-2022 http://www.MarketOracle.co.uk - The Market Oracle is a FREE Daily Financial Markets Analysis & Forecasting online publication.