Rising Commodities, Falling Stock Markets & Risk Reward Ratio
Commodities / Exchange Traded Funds Feb 01, 2009 - 12:25 PM GMTBy: Chris_Vermeulen

 Trading Risk/Reward
The past few months have been absolutely crazy in the financial markets. Financial advisors and banks are taking a beating from both the market condition and clients as individuals around the world are losing 30+ of their investments. We have seen oil prices drop over $110 per barrel from the high (73% decline), and the US dollar tumbled down to 71 and rebounded to 88 (23% gain) all in the mater of months.
Risk Management is what is needed if we want to stay in the game over the long term. Follow strict risk/reward rules is a must so that we don't not get caught chasing stocks and funds only to have them turn around on us a few days later.
Focusing on keeping risk low for potential trades is crucial for turning a profit over the long run. In short I look for a basket of indicators including candle patterns and volume to be in favor when buying or selling a stock or fund. When a fund generates a buy signal I wait for a low risk entry point near my support or resistance level depending if I am looking to go long or short. I need to see a perfect setup so that the odds are favoring my side. Only then will I take a stab at the market. The biggest issue with this is that I do miss a lot of good trades, but the key here is that most of my trades are profitable and that is what makes it so powerful. I would rather make 20 trades a year, than 150 trades and make the same profits.
This Weeks Analysis on Gold
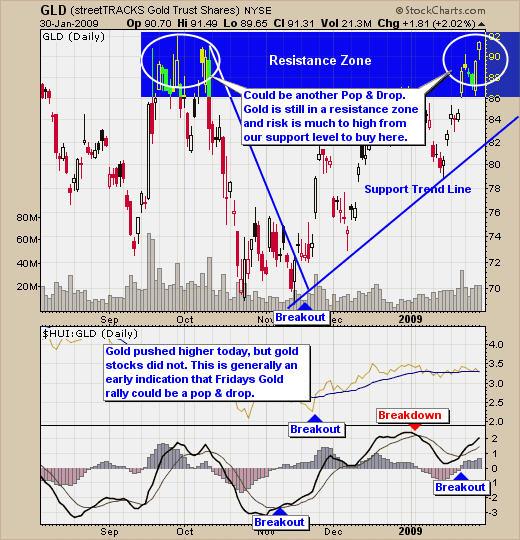
Gold continued its push higher last week getting a lot of investors and traders all excited. The daily chart does look strong and it is currently on a buy signal. But buying at this level is much too high of a risk. The price of gold is trading at the top of its 4 month trading range which previously led to a 20% selloff in bullion. Our support trend line is 10% away from the price of gold making it out of reach still. I trade reversals when risk is only 3% from my stop/support price.
Daily Gold GLD Chart

Gold Stocks
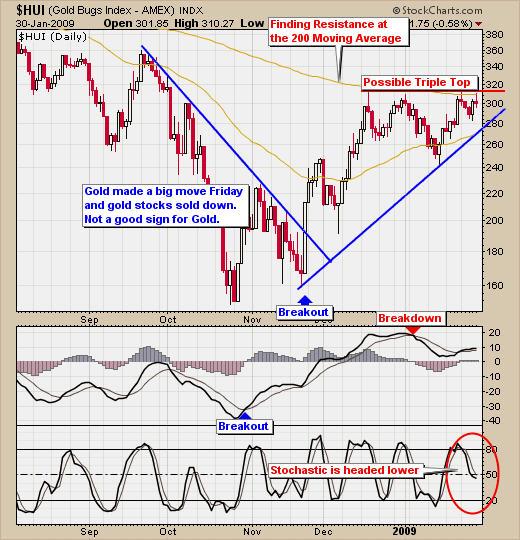
Gold stocks have been struggling to move higher and last Friday gold made a nice move higher while gold stocks sold down. My last article talked about how trading gold (GLD) may be a better investment then gold stocks right now simply because of the bearish broad market. The broad market looks like it's about to make another leg lower and when the broad market sells off, it pulls all stocks with it. The daily chart of the HUI Gold Bugs Index shows precious metal stocks moving sideways while gold pushed higher. When gold stocks start to underperform the price of gold I tighten my stops and mentally prepare myself for gold to pull back. The smart money always seems to move in and out of stocks faster than the commodity which is a topic I mentioned in a previous report as well.
Gold Bugs Index Daily Chart

Crude Oil Analysis
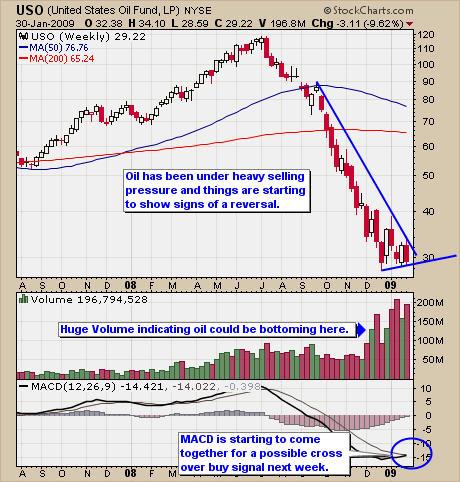
Crude Oil has been under continuous selling pressure for the past 7 months and this is the first buy signal I have had for it since it topped back in July 2008. The weekly chart is very close to a buy signal. If you look at the weekly chart of USO crude oil fund you will see that volume has shot through the roof which generally indicates a turning point. Also the MACD indicator is about to cross which will put this fund on a buy signal if things go well all of next week. The support trend line is trending up slightly and the down trend line is holding the price inside a small triangle. If the price breaks out and all my indicators are putting the odds in favor of a long trade, then we will be looking for a buy point on the weekly chart in the next few weeks. The weekly trading signals are good for intermediate and long term traders.
Crude Oil (USO) Weekly Trading Chart

Conclusion:
The broad markets continued to move lower last week as it remains in a long term bear market. For those looking to take advantage of gold, silver and oil movements I recommend sticking with the commodity funds as they can increase in value while the broad market is selling off. The daily chart of the hui gold bugs index shows this clearly as gold stocks in general are underperforming the price of gold right now. There is an opportunity for oil to make a move higher if things come together in the next couple of weeks but until then we will be patient and let the trade come to us.
If you have any questions please feel free to send me an email. My passion is to help others and for us all to make money together with little down side risk.
I look forward to hearing from you soon!
By Chris Vermeulen
Chris@TheGoldAndOilGuy.com
Please visit my website for more information. http://www.TheGoldAndOilGuy.com
Chris Vermeulen is Founder of the popular trading site TheGoldAndOilGuy.com. There he shares his highly successful, low-risk trading method. For 6 years Chris has been a leader in teaching others to skillfully trade in gold, oil, and silver in both bull and bear markets. Subscribers to his service depend on Chris' uniquely consistent investment opportunities that carry exceptionally low risk and high return.
This article is intended solely for information purposes. The opinions are those of the author only. Please conduct further research and consult your financial advisor before making any investment/trading decision. No responsibility can be accepted for losses that may result as a consequence of trading on the basis of this analysis.
Chris Vermeulen Archive |
© 2005-2022 http://www.MarketOracle.co.uk - The Market Oracle is a FREE Daily Financial Markets Analysis & Forecasting online publication.


