


Stock Market Bounce Coming
Stock-Markets / Investing 2009 Feb 19, 2009 - 03:23 AM GMTBy: Brian_Bloom

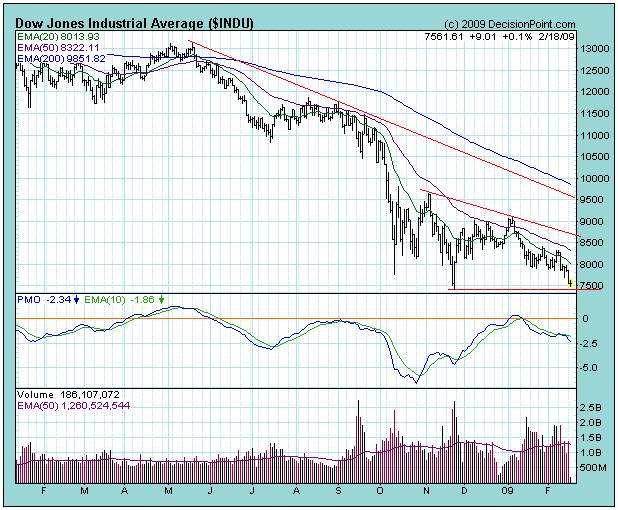
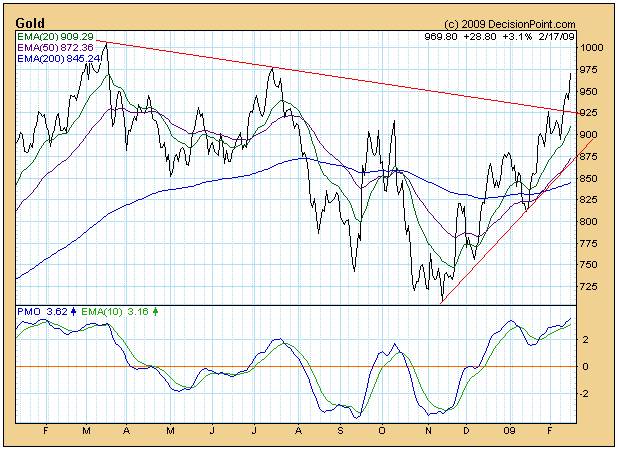
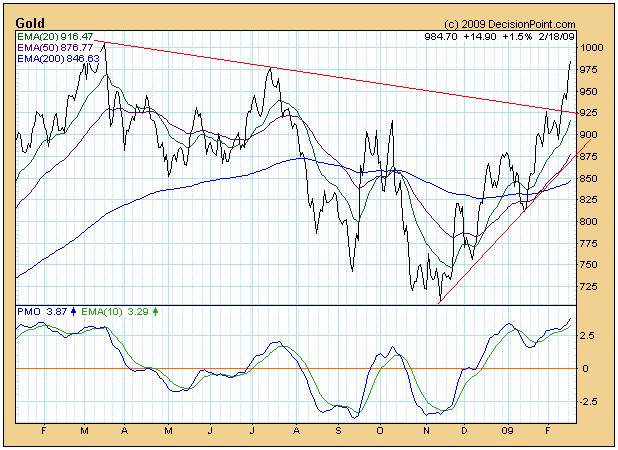
 No market goes straight up or straight down. Based on the charts below (courtesy Decisionpoint.com), it looks to this analyst that the Dow Jones Industrials Index (and $SPX) is due to bounce up from a double bottom at around 7500 and, if this happens, then the gold price may bounce down from a double top at around $1,000 an ounce.
Of course, if a double bottom is later penetrated on the downside this “may” prove to be extremely bearish, and if a double top is later penetrated on the upside, this “may” prove to be extremely bullish.
May?
Let's cut to the chase. As far as the industrial indices are concerned, there appears to be nothing on the horizon – apart, perhaps, from the possible discovery of a “free” source of energy to replace fossil fuels – that will lead to a reversal of the Primary Bear Trend in Industrial Equities within the foreseeable future. Based on the fundamentals, a failure of the industrial equity indices to continue along their Primary Bear Trend would defy all reason.
Whilst the same might be said for gold (i.e. the Primary Bull Trend seems likely to continue) there is, unfortunately, some evidence that the double top may represent the point at which a change in Primary Trend might occur. I want to stress the words “may” and “might”. The position is not yet clear-cut. I will present the evidence below and you can be the judge.
Industrial Indices
I have shown the chart below on several occasions (courtesy decisionpoint.com). It demonstrates the likely moves in the markets based on the assumptions that Price/Earnings ratios grow to become overvalued (red line) or contract to become undervalued (green line) – based on the foundational assumption that underlying earnings remain constant.
It can be seen that, if the investing market suddenly had a rush of optimistic blood to its head, and based on current earnings, the highest that the S&P 500's P/E ratio could possible rise given its historical performance, is approximately 30X. (Note that in 2000, the index was at 1500 which was at a 50% premium to the theoretically overvalued 20X P/E ratio price of around 1000 – as represented by the red line). That happened to coincide with the peak of the mania on the Nasdaq.
Unfortunately, earnings are unlikely to remain at current levels and there is no mania in any market, anywhere.
The reader needs to understand the difference between reported “operating” profits which are often the result of unethical game playing on the part of CEOs and CFOs of publicly owned corporations. CEOs and CFOs have fallen into the bad habit of putting a spin on the underlying performance of their organizations and reporting on a quarterly basis that which suits the personal agendas and the interests of the management teams. One example – to illustrate this point – could be that orders which have been invoiced but not yet delivered are taken into the current quarter's revenue numbers.
The ethical and more appropriate method of reporting profits would be to use “Generally Accepted Accounting Principles” (GAAP). For example, when using GAAP, there is no way that orders which have been invoiced but not yet delivered can be counted as revenue. They shouldn't have been invoiced at all. As a matter of law, that which has not yet left your premises remains your property, and ownership has not yet passed to the purchaser.
The above chart is based on Twelve Months Trailing (TMT) GAAP adjusted earnings, as adjusted by the people at Standard and Poor.
Now let's look at the forecast TMT – looking forward into the future by one quarter (trailing 9 months and forecast 3 months) and looking forward two quarters (trailing 6 months and forecast 6 months). The forecast numbers are derived from company forecasts as adjusted for GAAP by Standard and Poor, and the source of this information was also Decisionpoint.com.
Table 1
Forecast Price/Earnings ratios based on forecast TMT (as at February 17th 2009)
|
2008 Q3 | Est 2008 Q4 | Est 2009 Q1 | Est 2009 Q2 |
| TMT P/E Ratio (GAAP) | 17.2 |
28.5 |
38.5 |
49.6 |
| TMT P/E Ratio (Operating) | 12.2 |
14.3 |
14.9 |
15.1 |
It can be seen from the above numbers that either the CEOs and CFOs are becoming increasingly creative in their accounting, or Standard and Poor is becoming increasingly creative in its adjustments.
If the CEOs and CFOs are accurate then, in terms of the P/E ratio chart above, 15X will represent “Fair Value” and the Primary Trend of the market could change from Bearish to Bullish.
Of course, if Standard and Poor is accurate in its GAAP adjustments of forecasts, then we will watch a Wyle E Coyote market in action as the market plunges off a cliff when it breaks down below the double bottom level at around 785 (after a bounce which is likely to entice yet more lambs into the slaughterhouse).
For the record, if the S&P GAAP adjustments to forecast earnings are correct and the P/E ratios remain at “fair value” of 15X, then the Standard and Poor Industrial Index will likely fall from its current 789 to 239 within the next six months, or by a further 70%.
Those are the facts regarding the industrial equities. Now let's turn to the gold price.
Gold
This analyst recently went into semi-retirement and moved on a trial basis with his wife to a little town with a population of 1200 people, a couple of hours drive from Sydney . The majority of his capital is invested in 3 month rollover fixed deposits. Six months ago, the return on a 3 month fixed deposit account was 8%. Three months ago it fell to 6%. Recently, it fell to just over 4%. It is being forecast by some that, within the next three months, the return will fall to 2% as the Australian Government fights to “stimulate” the economy. It is therefore a matter of unarguable fact that the Australian Government (and most other governments in the world) are choosing to reward those who have been behaving irresponsibly and who have gotten themselves into too much debt; and to punish those of us who have been behaving with fiscal responsibility for the past few decades.
I record this information to illustrate that what I am about to say is not some esoteric “theory”. It is fact. The issue, going forward, will be “income”. How will people who will be retrenched from their jobs live without income? How will retired people live – even if they have relatively large licks of capital – if the returns on their investment have been slashed by 75%, courtesy of the governments we elected to represent our interests? Where will the money come from for the various governments around the world to pay the unemployment benefits and/or pensions to which all these people are supposedly “entitled”?
The fact is that gold pays no interest. It is a means of preserving capital in a world of price inflation. It is a ‘safe haven' in an inflationary environment. We don't need gold as a safe haven in a deflationary environment. In such an environment cash is king, and gold is not “cash”. This is a very important fact which this analyst has been trying to communicate over the past few years. Gold may be a safe haven. It may be a store of value. It may be a currency of last resort. But it will never be “cash” in the sense that you can use it to buy a loaf of bread. Historically, that has been the role of silver.
We are constantly hearing from the mavens that theory says that, with the vast amounts of cash being injected into the economies by the world's central banks, the world in general (and the USA in particular) is headed for a period of hyperinflation.
Oh? Is that so? The unarguable fact is that this will only happen if the rate at which money supply is increased exceeds the rate at which velocity of money decreases. If money supply rises (say) 25% and velocity of money falls by (say) 33% then the outcome will be price deflation. With that in mind, let's proceed to see what the market as a whole is telling us.
If we are headed for a period of inflation, then wouldn't the price of money be rising to compensate for that fact? If I lend the government $100 today and I know that there will be inflation of (say) 10% p.a., then why would I lend the government that money at (say) 3% for 30 years? I must have rocks in my head to do that.
Below is a chart of the 30 year Treasury Bond yield in the USA .
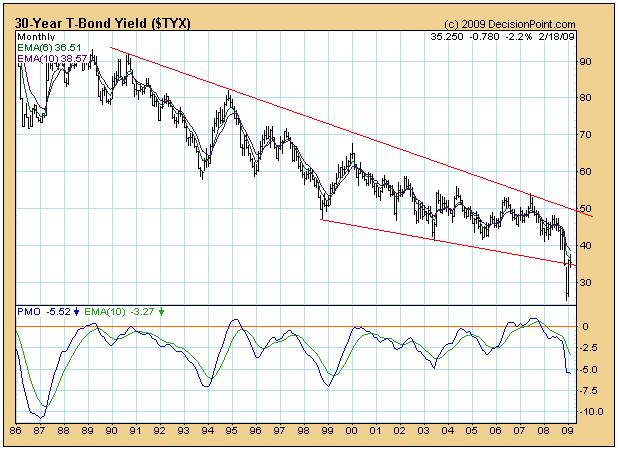
Does this chart look like it is anticipating rampant inflation?
Well, perhaps the yields are falling because there has been a so-called “flight to safety”. Investors with nowhere else to put their money have been piling it into the “safety” of “risk free” US Government Bonds.
Risk Free?
“You've got to be kidding!” you respond. “The US economy is a basket case. The US Government is hopelessly insolvent. The US Dollar is virtually certain to fall out of bed. Any day now, you mark my words.”
Oh really? The chart below reflects the movements of the US Dollar. Does this look like a chart that wants to collapse?
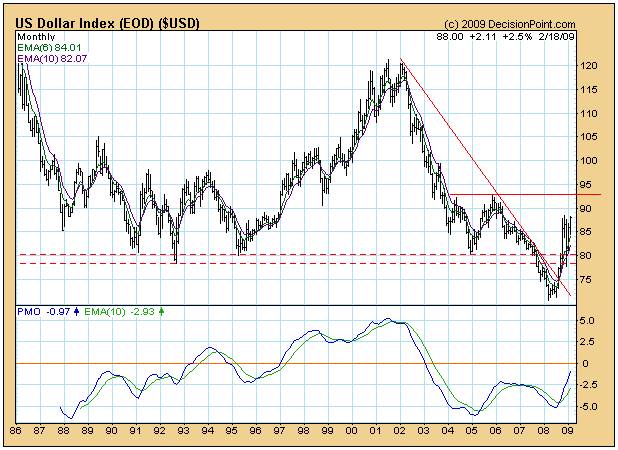
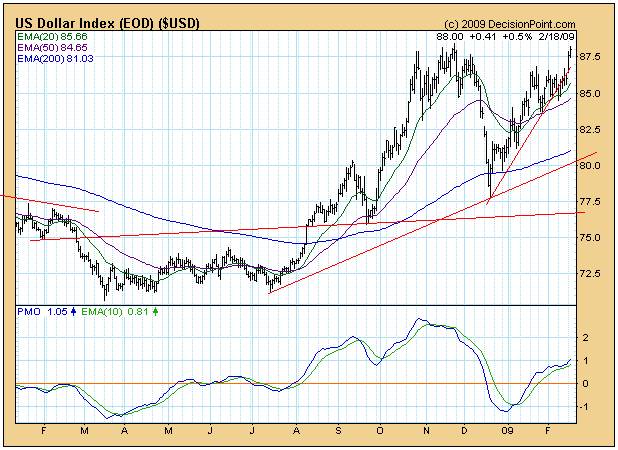
Note the non-confirmation of the rising bottoms on the PMO oscillator and the falling bottoms in the price chart. It looks to this analyst that 90 – 92 will offer resistance to further rises. Maybe, based on the daily chart below, the Dollar is even reaching for a double top – just like the gold price.
But aren't the dollar and gold supposed to move inversely?
Well, that's what theory would argue. But the reality is that relatively large amounts of money have been pouring into US treasuries from offshore – thereby putting downward pressure on US Government Bond Yields and upside pressure on the US Dollar.
At the same time, a relatively small amount of money has also been pouring into gold as a non-interest bearing safe haven.
But here's the thing. As the US stock market falls further and further, the dividend yields of those companies which remain relatively health are likely to rise – which they have in fact been doing, as can be seen from the chart below.
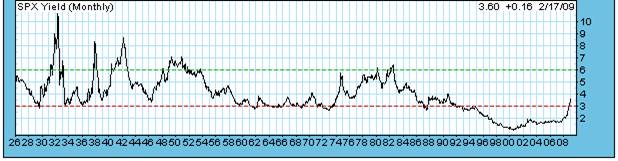
Perhaps the appropriate behaviour of prudent investors will be to wait until the dividend yields peak out at around 6% (or even higher, as they did in 1932) before taking money out of fixed deposit. Perhaps the appropriate behaviour will be to just “park” one's capital in a safe haven until the dust settles; and maybe even choose to augment one's income by dipping into capital for a few months?
Well, where's a safe haven?
The chart below is nothing short of amazing. It shows that “the market” is saying that both gold and the US dollar are being regarded as safe. The goldollar index is derived by multiplying the gold price by the US dollar index. It has been breaking to new highs.
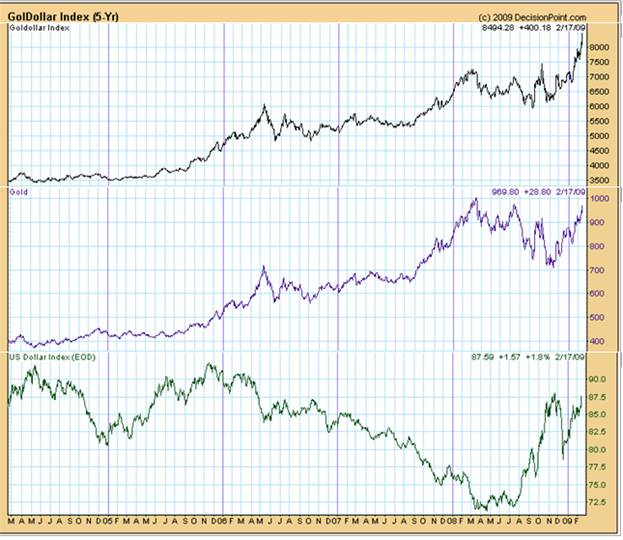
There can be no question that the goldollar index is bullish – implying that both the gold price and the US Dollar are likely to remain relatively strong.
And this brings us to the difference between practice and theory. In theory, the US Dollar should be collapsing. In fact, if the US dollar were to collapse then, because there is no practical alternative to the US Dollar as a world currency, the entire world's economy would implode. Trade between nations would cease altogether. The “fact” is that there is no alternative to the dollar.
There are those who would argue that gold represents an alternative to the US Dollar and that the world needs to return to a gold standard. Well, apart from the fact that the market clearly disagrees with this argument as per the goldollar chart above, this analyst has demonstrated in an earlier article that the theoretical price of gold needs to rise to well over $14,000 an ounce (maybe as high as $17,000 a ounce) to facilitate that outcome – and still allow the US government to continue to meet its sovereign obligations to other countries – to say nothing of pension fund, unemployment and medical aid entitlements of its own citizens.
If the gold price rises to (say) $15,000 an ounce, what do you think will likely happen to confidence? I can tell you that it would scare the pants off me and I consider myself to be a fairly normal individual. I would very likely start to grow my own vegetables and keep having my car repaired over the next 5-10 years rather than replace it, and stop worrying about whether the clothes I am wearing are fashionable or not. I would take my kayak up the local river rather than a trip on an ocean liner to some exotic location which is probably inferior to where I am living right now. In short, if most “normal” people reacted in the same way, the world's economic gyroscope would slow down (as it is now doing in any event) and would eventually fall over altogether (which it might not do if we keep going like we are).
Why might it not fall over now?
Because right now, people are still behaving rationally – as evidenced by the following chart, courtesy yahoo.com
Chinese Yuan to U.S. Dollar Exchange Rate
What this chart is showing is that money is (quietly) moving from US Dollars into Chinese Yuan. It takes a higher proportion of one US Dollar to buy a Chinese Yuan than it did in 2005. What does this mean? It means that, although there is an upward pressure on US$ denominated prices for Chinese Exports , there is a downward pressure on US Dollar denominated imported input costs to Chinese Manufacturers.
Have a look at the Commodities Index below:
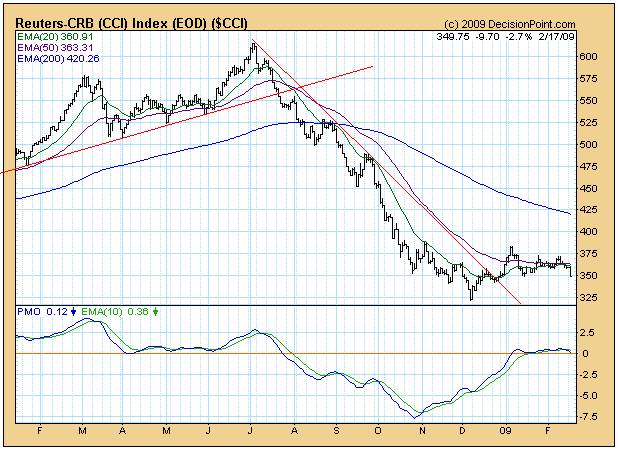
Within the Chinese economy, not only are commodity prices falling in dollar terms, but the dollar is falling in Yuan terms. This will allow China to reduce its costs and prices internally – thereby stimulating its own domestic economy.
Of course, all of this will take time to evolve given that China has, until recently, been suffering from wage inflation. But this pressure is abating.
In summary, it seems that the world is still behaving rationally at the more sophisticated level and there are, as yet, no signs of panic in the currency markets or the bond markets. Panic, if any, will occur in the equity markets.
But if there are no signs of panic in the currency markets, then why would the gold price explode if it supposed to be the “ultimate” currency?
The answer is that it seems unlikely to explode. What seems to be happening is that prudent investors are putting a proportion on their assets into gold as an insurance policy against catastrophe. Whilst there might well be catastrophe in the equity markets, the bond markets seem to be behaving normally. Yes, if you look at the chart of the 30 year yields above, there was a period of panic as money flooded into the 30 year bonds. But that seems to have normalized itself and yields are continuing to trend downwards. By implication, the markets are not expecting hyperinflation within the US economy and this is validated by a relatively strong dollar index – which looks likely to remain relatively strong based on the goldollar index.
Should we be getting out of gold? Absolutely not! It is an insurance policy.
Should we be bailing into gold? Except as an insurance policy, why would we do that? It pays no interest in a world where “income” is the word that is on everyone's mind.
Perhaps its time we started to take a closer look at what's going on inside China .
Why China only? Why not India ? Or Russia or Brazil .
Well, have a look at the charts of the exchange rates of these countries' currencies relative to the US Dollar, again courtesy yahoo.com:
Indian Rupee to U.S. Dollar Exchange Rate
Russian Rouble to U.S. Dollar Exchange Rate
Brazilian Real to U.S. Dollar Exchange Rate
These latter three charts need no further comment. The market prefers the US Dollar to all of them.
Conclusion
Given that the world's sophisticated investors appear to be behaving rationally on the currency markets and the bond markets, a sharp contraction of the equity markets is unlikely to give rise to either a collapse in the US Dollar or an explosion in the gold price. Gold may hit a double top and reverse from there or, if it breaks through, it will likely continue rising relatively slowly as prudent investors continue to buy it for insurance purposes. However, if the world is heading for “deflation” – which might well be the case given the downward pressure on commodity prices and the refusal of interest rates to rise, then $1,000 may be the ultimate peak of the gold price for the foreseeable future. If one takes a closer look at the chart of the gold price (second from the top) one will see a fairly seriously overbought position in the PMO oscillator.
Author's note
So what does one do in the current environment?
Personally, I am very intrigued by the implications of the chart showing rising dividend yields. My guess is that dividend yields will continue to rise over the next few months as the equity markets tank. If one has patience, it seems that – once the dust has settled within the next 9-12 months – the rising dividend yields are going to exert an upward pressure on bond yields. Perhaps one should think of dipping into capital to augment earnings over the next 9-12 months rather than gamble with one's capital, because it seems that money will begin moving out of government bonds and into high quality equities. Yields (and investment income) will rise. This, in turn, will put a further upward pressure on the US Dollar and exert a downward pressure on US import prices – but it begs the question regarding how the debt mountain will be managed.
In this latter regard I see only one course of action that could possibly lead to a positive outcome. The world's politicians need to stop “posturing” and start behaving ethically. Yes, we have climate change. No it is not being caused by CO2 emissions. As is set out in my factional novel, Beyond Neanderthal, the only sensible way forward is to focus on wealth creation activities which are based on energy paradigms that are unrelated to fossil fuels. For a variety of reasons (including a risk management response to climate change) we need to move away from the centrally produced electricity model and, like the move from mainframes to PC's in the IT industry, we need to shift electricity production closer to the point of consumption. This will empower local communities, including those in third world countries. The increasing momentum of a planetary wide focus on gainful economic activity at primary industry level will get the world economy going again.
But it's not only about economics. The story is far more complex. That's why you would benefit from acquiring a copy of Beyond Neanderthal , which can be ordered via the website below.
By Brian Bloom
Beyond Neanderthal is a novel with a light hearted and entertaining fictional storyline; and with carefully researched, fact based themes. In Chapter 1 (written over a year ago) the current financial turmoil is anticipated. The rest of the 430 page novel focuses on the probable causes of this turmoil and what we might do to dig ourselves out of the quagmire we now find ourselves in. The core issue is “energy”, and the story leads the reader step-by-step on one possible path which might point a way forward. Gold plays a pivotal role in our future – not as a currency, but as a commodity with unique physical characteristics that can be harnessed to humanity's benefit. Until the current market collapse, there would have been many who questioned the validity of the arguments in Beyond Neanderthal. Now the evidence is too stark to ignore. This is a book that needs to be read by large numbers of people to make a difference. It can be ordered over the internet via www.beyondneanderthal.com
Copyright © 2009 Brian Bloom - All Rights Reserved
Disclaimer: The above is a matter of opinion provided for general information purposes only and is not intended as investment advice. Information and analysis above are derived from sources and utilising methods believed to be reliable, but we cannot accept responsibility for any losses you may incur as a result of this analysis. Individuals should consult with their personal financial advisors.
Brian Bloom Archive |
© 2005-2022 http://www.MarketOracle.co.uk - The Market Oracle is a FREE Daily Financial Markets Analysis & Forecasting online publication.