


The Moving Averages Based Stock Feeder Pond Trading Technical Tool
Commodities / Crude Oil Mar 03, 2009 - 05:06 PM GMTBy: Marty_Chenard

 A powerful use of the Moving Average concept ... Most investors use Moving Averages on their charts ... like the 20 day, 50 day, 100 day, and 200 day moving average. As indicators they lag behind movement, which is why many like to use an Exponential Moving Average over a Simple Moving Average.
Many investors like to use Moving Averages as a technical indicator on their charts. That is one way to use moving averages, but many professionals also like to follow the "percentage of stocks" that are above or below various averages.
Using them as technical indicators is one way to use moving averages, but many professionals also like to follow the "percentage of stocks" that are above or below various averages.
The reason why professionals like to follow Moving Average Stock Percentages ...
Years ago, when I used to fish in New Hampshire, I used to drive by ponds and quickly read whether they were a "feeder pond" or not. To me, a " feeder pond " was one where I knew that the reproduction rate of the bass and other species was extremely high and fast. The key to being a feeder pond or not had to do with its vegetation, which was part of the support that I wanted to see in that ecosystem. Needless to say, it was normal to catch a string of bass at sunset and have a great meal.
If you can understand the concept of a "feeder pond", then you can understand the importance of using the "% of stocks above their Moving Average" for a multiple series of moving averages. And why that can be an important key to knowing the direction of the markets, and/or finding new stocks that are ready to have a bullish run.
Now think about this process ...
- For a stock to move above its 50 day moving average, it first has to move above its 20 day moving average.
- For a stock to move above its 100 day moving average, it first has to move above its 50 day moving average.
- For a stock to move above its 150 day moving average, it first has to move above its 100 day moving average.
The "feeder pond" concept ...
*** So, stocks above their 20 day moving average is the "feeder pond" for the stocks that WILL gravitate to the point of going above their 50 day moving average .
*** And the stocks above their 50 day moving average is the "feeder pond" for the stocks that WILL gravitate to the point of going above their 100 day moving average. I am sure you get the concept, and understand why this is important.
Are the "feeder ponds" breeding new fish or are they dying off? Are the "stock feeder ponds" breeding new rally-stocks, or are they dying off?
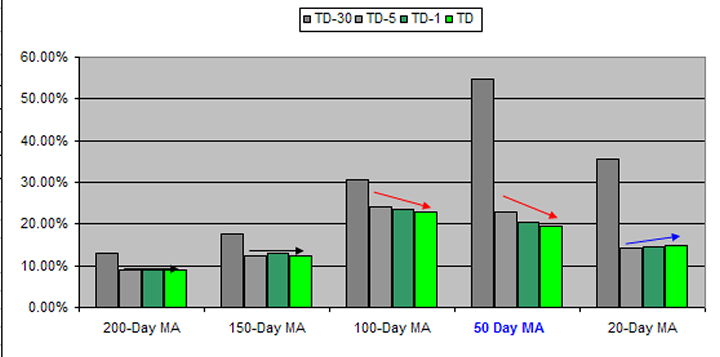
Today, we will explore The percentage of stocks that are above a moving average of 20, 50, 100, 150, and 200. We will also look at how those percentage numbers changed over a 1, 2, 5, and 30 day period of time (in the chart below: TD is today, TD minus one is yesterday, TD minus 5 is last week, and TD minus 30 is last month.)
Feeder pond observations:
First, look at the maximum heights of each moving average category in the chart below. Looking at them, you can notice that the 50 Day Moving Average category had the highest percentage 30 days ago. That said that the feeder pond for the 100 day moving average looked hopeful as there were a lot of stocks in the pool. However , to keep that expanding and rallying, the 20 day Moving Average percentage for 30 days ago would have had to be at a higher percentage to keep an expanding feed going on. It didn't have a higher percentage, instead ... the percentage was 20% lower. That gave you the knowledge that the whole feeder process could be in trouble.
Now ... look at what happened in the last 5 days. The percentage of stocks in the 20 day feeder pond fell in half ... that meant that the 50 day pond will have its current supply of NEW stocks die off. When you look at the 50 day feeder pond, you can see that the EXISTING supply of stocks died off and fell dramatically.
Now, if you look at the green bars, you can see that last Friday's 20 day moving average "feeder pond" was LOWER than the 50 day moving average "feeder pond". That means there will be an expected decline in the number of stocks above their 50 day moving average in the next few days. And if the number of stocks above a 50 day moving average decline, then the stock market will decline.
Look at it this way ... expanding "stock feeder ponds" produce higher points on the DOW and other indexes. Contracting "stock feeder ponds" produce lower points on the DOW and other indexes.
Is there a reason for presenting today's information? Yes, it is to get each of you thinking outside of the box ... to expand how you think about the stock market so that you can all be better investors as you approach your retirement years.
________________________________________________
*** Feel free to share this page with others by using the "Send this Page to a Friend" link below.
By Marty Chenard
http://www.stocktiming.com/
Please Note: We do not issue Buy or Sell timing recommendations on these Free daily update pages . I hope you understand, that in fairness, our Buy/Sell recommendations and advanced market Models are only available to our paid subscribers on a password required basis. Membership information
Marty Chenard is the Author and Teacher of two Seminar Courses on "Advanced Technical Analysis Investing", Mr. Chenard has been investing for over 30 years. In 2001 when the NASDAQ dropped 24.5%, his personal investment performance for the year was a gain of 57.428%. He is an Advanced Stock Market Technical Analyst that has developed his own proprietary analytical tools. As a result, he was out of the market two weeks before the 1987 Crash in the most recent Bear Market he faxed his Members in March 2000 telling them all to SELL. He is an advanced technical analyst and not an investment advisor, nor a securities broker.
Marty Chenard Archive |
© 2005-2022 http://www.MarketOracle.co.uk - The Market Oracle is a FREE Daily Financial Markets Analysis & Forecasting online publication.