


Stocks Bear Market Favors Lower Lows
Stock-Markets / Stocks Bear Market Mar 16, 2009 - 08:31 PM GMTBy: Chris_Ciovacco

 There is no shortage of forecasters who continue to call a bottom in stocks. As appealing as that may appear to the casual observer, the wise investor is aware of the inherent danger of listening to anyone's forecast for the financial markets.
Rather than relying on forecasting, investors would be better served to think in terms of probabilities associated with numerous outcomes, both favorable and unfavorable. Investing based on probable outcomes involves (a) identifying the higher probability outcome, (b) investing based on the higher probability outcome, (c) understanding you could be wrong (when lower probability outcome is the actual outcome), (d) admitting when you are wrong by cutting losses at meaningful price points, (e) letting profitable investments run (when you are right), and (f) repeating all of the above.
As clearly shown in the charts below, the odds favor lower lows in stocks. When we see evidence to the contrary, we will happily become bullish. At this moment, the current rally is built on emotion and hope - devoid of sound fundamentals or sound technicals. Investors with proven track records do not make decisions based on emotions or hope. Successful investors make decisions based on observable evidence. When the observable evidence gives us reasons to be bullish, we will be more than receptive to implementing a plan for the possibility of a more favorable investment climate.
When Trends Align In Multiple Time Frames, They Are More Meaningful: The S&P 500 (SPY, SH, SSO, SDS) has made what feels like an impressive move off the recent lows. However, stocks have made "impressive moves" off the lows numerous times since the bear market began in October of 2007. If you look at the charts below, it is clear every single rally in this bear market has been unable to (a) break the primary downtrend, or (b) clear the 200-day (or 200-period) moving average. The odds say the same thing will happen this time. The longer the trendline (in terms of time), the more important it is to long-term investors. The shorter-term trendlines can help us monitor a possible turn in stocks.
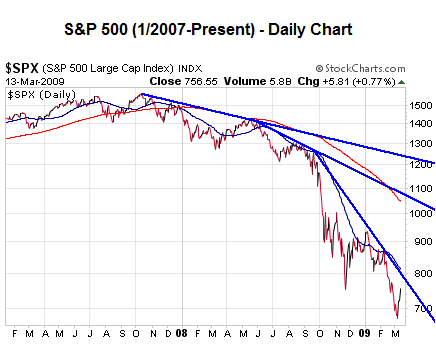
The chart above plots daily prices for the S&P 500 going back to January 2007. All of the following support lower-lows in stocks in terms of probabilities :
- Price is below the 200-day moving average (red line), which is bearish
- The 50-day moving average (thin blue line) is below the 200-day moving average (red line), which is bearish.
- The slope of the 200-day moving average (red line) is negative, which is bearish.
- Trendlines (three thick blue lines) all have negative slopes, which is bearish.
- Prices are making lower highs and lower lows, which is bearish.
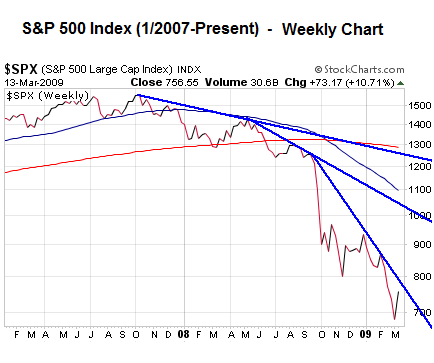
Now we will look at other timeframes on the S&P 500. The chart above plots daily prices for the S&P 500 going back to January 2007, but it uses weekly prices instead of daily prices. All of the following support lower-lows in stocks in terms of probabilities :
- Price is below the 200-period moving average (red line), which is bearish
- The 50-period moving average (thin blue line) is below the 200-day moving average (red line), which is bearish.
- The slope of the 200-period moving average (red line) is negative, which is bearish.
- Trendlines (three thick blue lines) all have negative slopes, which is bearish.
- Prices are making lower highs and lower lows, which is bearish.
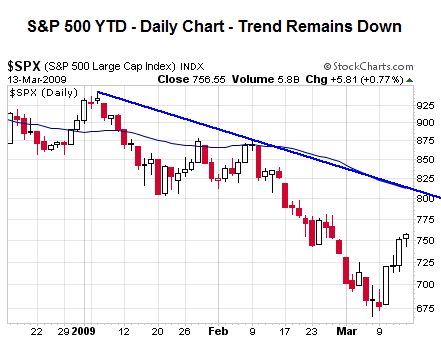
The chart above plots daily prices (bars show daily highs and lows) for the S&P 500 going back roughly to the beginning of 2009. All of the following support lower-lows in stocks in terms of probabilities :
- Price is below the 200-day moving average (red line), which is bearish. The 200-day line is not shown since it is "off the charts" (above).
- The 50-day moving average (thin blue line) is below the 200-day moving average (red line), which is bearish.
- The slope of the 200-period moving average (red line) is negative, which is bearish.
- The Trendline (thick blue line) has a negative slope, which is bearish.
- Prices are making lower highs and lower lows, which is bearish.
When we refer to probabilities above, it takes into account we could be wrong. It is quite possible, but not probable, the lower probability scenario (the end of the bear market) could play itself out. If that is the case, it is not the end of the world, nor does it mean we cannot have a good year of investing. In either case, if we continue to align ourselves with the higher probability outcomes, cut losses when we are wrong, and ride winners when we are right, we will have greatly improved our odds of success. The long-run is the time period we should all be concerned about. Ask yourself this question:
"Have I ever made sound investment decisions over a long-period of time by (a) listening to my emotions or gut, (b) following the crowd at all times, or (c) basing those decisions on fear, greed, hope, or financial forecasts?"
The key phrase above is sound investment decisions over a long-period of time . If the answer is "no", then doesn't it make sense to avoid making the same mistakes again? The charts above show us the collective hope and fears of all market participants. Despite numerous counter-trend rallies, the collective hopes and fears of all market participants continue to drive stock prices lower.
Until we see evidence the collective hopes and fears of all market participants are enabling stocks to make meaningful higher highs, instead of lower lows, it is best to remain aligned with the downward sloping trend. We remain open to both bullish and bearish outcomes. Investing is not about being right, but about making money. If the markets indicate a possible shift in investors' willingness to accept risk, we will happily look for prudent entry points in several markets. We are not there yet. It is all about aligning ourselves with the higher probability outcomes while understanding we could be wrong. Over the long-run, more often than not , we should be right.
The charts and commentary above are for illustrative purposes only and are not recommendations to buy or sell any security.
Disclosure: The author and his clients have positions in SH
By Chris Ciovacco
Ciovacco Capital Management
Copyright (C) 2009 Ciovacco Capital Management, LLC All Rights Reserved.
Chris Ciovacco is the Chief Investment Officer for Ciovacco Capital Management, LLC. More on the web at www.ciovaccocapital.com
Ciovacco Capital Management, LLC is an independent money management firm based in Atlanta, Georgia. As a registered investment advisor, CCM helps individual investors, large & small; achieve improved investment results via independent research and globally diversified investment portfolios. Since we are a fee-based firm, our only objective is to help you protect and grow your assets. Our long-term, theme-oriented, buy-and-hold approach allows for portfolio rebalancing from time to time to adjust to new opportunities or changing market conditions. When looking at money managers in Atlanta, take a hard look at CCM.
All material presented herein is believed to be reliable but we cannot attest to its accuracy. Investment recommendations may change and readers are urged to check with their investment counselors and tax advisors before making any investment decisions. Opinions expressed in these reports may change without prior notice. This memorandum is based on information available to the public. No representation is made that it is accurate or complete. This memorandum is not an offer to buy or sell or a solicitation of an offer to buy or sell the securities mentioned. The investments discussed or recommended in this report may be unsuitable for investors depending on their specific investment objectives and financial position. Past performance is not necessarily a guide to future performance. The price or value of the investments to which this report relates, either directly or indirectly, may fall or rise against the interest of investors. All prices and yields contained in this report are subject to change without notice. This information is based on hypothetical assumptions and is intended for illustrative purposes only. THERE ARE NO WARRANTIES, EXPRESSED OR IMPLIED, AS TO ACCURACY, COMPLETENESS, OR RESULTS OBTAINED FROM ANY INFORMATION CONTAINED IN THIS ARTICLE. PAST PERFORMANCE DOES NOT GUARANTEE FUTURE RESULTS.
Chris Ciovacco Archive |
© 2005-2022 http://www.MarketOracle.co.uk - The Market Oracle is a FREE Daily Financial Markets Analysis & Forecasting online publication.
Comments
|
TraderJoe
16 Mar 09, 21:29 |
Wheres your forecast?
So basically your saying you don't have a clue, didn't you forecast a rally in January ? LOL
|