


Stock Market Investor Sentiment Improves as Investors Seek Riskier Assets
Stock-Markets / Financial Markets 2009 May 03, 2009 - 06:49 AM GMT

 “Goodbye safe havens, hello risky assets.” This was the refrain of investors’ theme song during the past week. Safe-haven assets were out of favor as better-than-feared corporate earnings and signs of a budding economic recovery emboldened investors’ appetite for reflation trades such as equities and commodities.
Investors’ sentiment improved notwithstanding a number of influences that could potentially disturb financial markets. These included a three-day delay in the release of the stress test results of the 19 biggest US banks until May 7, the plight of the beleaguered US automakers with General Motors (GM) proposing a sweeping debt-for-equity restructuring and Chrysler filing for Chapter 11 bankruptcy protection, and fears of an escalation in the number of swine flu (H1N1) cases.
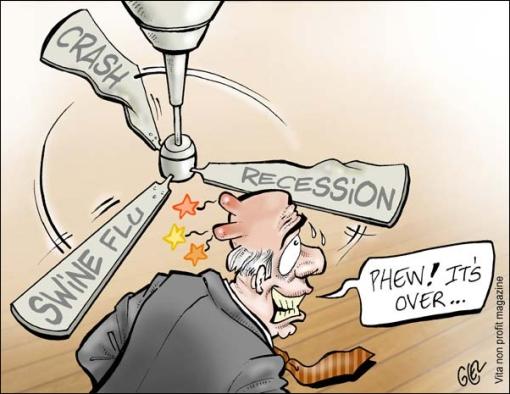
Source: Vita
As to be expected given the countless catalysts, the past week’s trading was bumpy, but the major global stock market indices nevertheless managed to resume their eight-week rally. Further testimony of investors’ zest for risky assets came from the following:
• a solid performance by crude oil, base metal and agricultural commodities (with the exception of pork bellies and lean hogs - despite the fact that humans cannot contract swine flu by eating pig meat)
• tighter credit spreads (especially high-yield corporate bonds)
• a jump in Treasury Note yields to levels last seen in November
• a decline in the US dollar and Japanese yen as traders switched to high-yielding currencies such as the Australian dollar, New Zealand dollar and South African rand (all resource-linked currencies)
The performance of the major asset classes is summarized by the chart below, expanded to now also include Treasury inflation-protected securities (TIP) and investment grade (LQD) and high-yield corporate bonds (HYG).
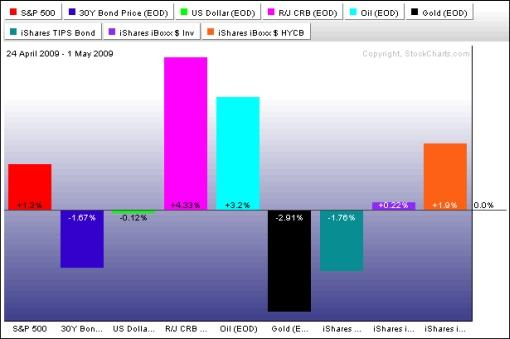
Source: StockCharts.com
Marking eight straight weeks of gains, the MSCI World Index advanced by 1.6% (YTD -2.6%) on the week, the MSCI Emerging Markets Index by 2.3% (YTD +16.9%) and the Nasdaq Composite Index by 1.5% (YTD +9.0%) - the Nasdaq’s longest advance since December 1999. After recording declines during the prior week, the Dow Jones Industrial Average (+1.7%; YTD -6.4%) and the S&P 500 Index (+1.3%; YTD -2.8%) also added to the gains notched up since the rally commenced off the March 9 lows.
Global indices also celebrated solid gains for calendar month April, with the MSCI World Index (+10.9%) recording its top monthly advance since January 1987 and the MSCI Emerging Markets Index (+16.3%) its strongest monthly showing since December 1993. The S&P 500 (+9.4%) had its best month since March 2000, placing the Index in the middle of its top 20 monthly gains since 1950.
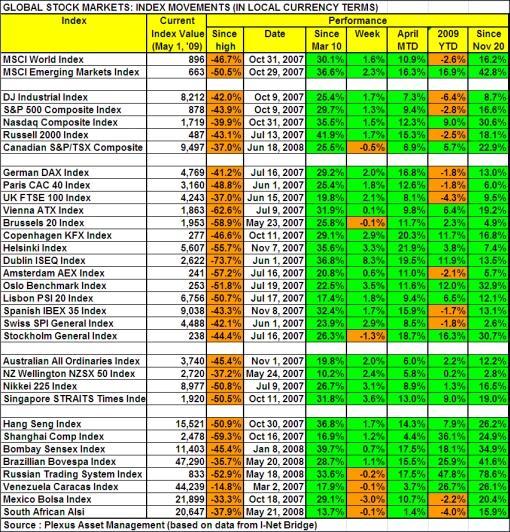
Using four-day performances for markets that were closed for the May Day (International Workers’ Day) holiday on Friday, returns around the world ranged from top performers Indonesia (+8.7%), Ireland (+8.4%), Greece (+8.1%), the Czech Republic (+6.9%) and Turkey (+6.7%) to Luxembourg (-4.7%), Bulgaria (-4.0%), Malta (-2.7%), Macedonia (-2.6%) and Oman (-2.5%), which experienced selling pressure. The Mexican Bolsa Index surprised by only declining 3.0% amid swine flu fears. (Click here to access a complete list of global stock market movements, as supplied by Emerginvest.)
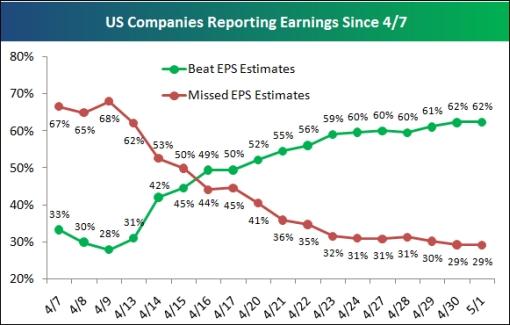
By the end of last week, more than 70% of the companies in the S&P 500 Index had reported first-quarter earnings. According to Bespoke, the Index’s annual decline in earnings (Q1 ‘09 versus Q1 ‘08) on Friday was of 32.3%. This compares with analysts’ estimates of -37.4% at the start of the earnings season. Also, as shown in the graph below, the percentage of companies beating earnings estimates has been rising steadily during the reporting period to 62% on Friday. ”With three quarters of companies having already reported, this earnings season is shaping up to be one of the best in years,” said Bespoke.
John Nyaradi (Wall Street Sector Selector) reports that the strongest exchange-traded funds (ETFs) on the week were the Market Vectors Coal (KOL) (+15.1%), iShares MSCI Taiwan Index (EWT) (+13.8%) and Claymore US-1-The Capital Markets Index (UEM) (+11.4%). On the other end of the performance scale the SPDR KBW Bank (KBE) (-6.1%), PowerShares Active US Real Estate (PSR) (-5.8%) and Vanguard Extended Duration Treasury Index (EDV) (-5.7%) performed poorly.
For April, the “ETF of the Month” was the iShares Dow Jones Real Estate Fund (IYR) that gained +22.6%. Click here for a chart.
An interesting analysis on country ETFs was published by Bespoke last week, specifically indicating that markets around the world are extended into overbought levels from their normal trading ranges. Click here for the study.
On the credit front, the cost of buying credit insurance for US and European companies eased during the past week, as shown by the narrower spreads for both the CDX (North American, investment grade) Index (down from 175 to 163) and the Markit iTraxx Europe Index (down from 153 to 139).
Another indicator worth monitoring is the Barron’s Confidence Index. This Index is calculated by dividing the average yield on high-grade bonds by the average yield on intermediate-grade bonds. The discrepancy between the yields is indicative of investor confidence. There has been a solid improvement in the ratio since its all-time low in December, showing that bond investors are growing more confident and have started opting for more speculative bonds over high-grade bonds.

Source: I-Net Bridge
The quote du jour relates to the stress test and belongs to Bill King (The King Report), who said: “A major problem with the ‘stress test’ is it depends on modeling and it’s the precise practice responsible for much of this economic and financial mess. It’s extraordinary that so many people believe that the Fed and Treasury, after missing the financial disaster, housing debacle, recession and derivative implosion, can now extrapolate economic conditions and resultant financial effects from its models. How did all that rocket-science modeling for subprime defaults and securitization workout? Yet many people already forget or ignore this reality.”
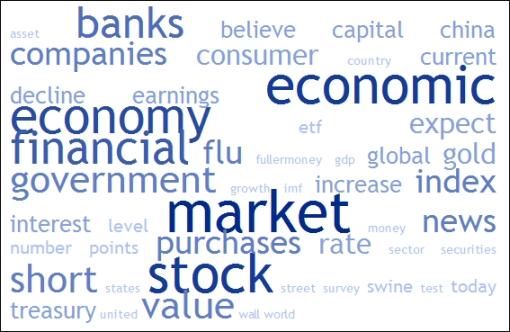
Next, a tag cloud of all the articles I read during the past week. This is a way of visualizing word frequencies at a glance. Key words such as “market”, “stock”, “economic”, “economy”, “bank” and “financial” again featured prominently. Let’s hope “flu” does not stake its claim among the dominant words over the next few weeks.
But back to the stock market. In order to gather some perspective on the current stock market rally, Chart of the Day highlighted the duration (calendar days) and magnitude (percentage gain) of all significant Dow rallies that occurred during the 1929-1932 bear market (solid blue dots). By means of illustration, the bear market rally that began in October 1931 lasted 35 calendar days and resulted in a gain of 35%. “… the current Dow rally (hollow blue dot labeled ‘You are here’) is slightly below average in both duration and magnitude relative to the average 1929-1932 bear market rally (hollow red dot),” said Chart of the Day.
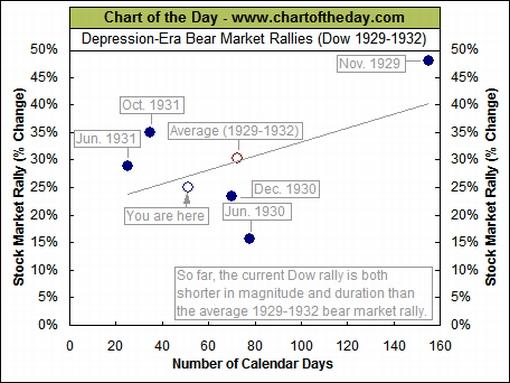
Source: Chart of the Day, May 1, 2009.
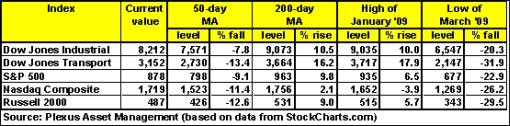
As shown in the table below, the 50-day moving averages have been cleared comfortably by all the major US indices and the early January highs are the next important targets. As a matter of fact, the Nasdaq Composite Index is already above this level. It has to rise by a further 2.1% in order to reach the key 200-day moving average - an indicator often used to distinguish between primary bull and bear markets. On the downside, the levels from where the nascent rally commenced on March 9 should hold in order for the upward trend to remain intact.
Two S&P 500 sectors - Consumer Discretionary (XLY) and Technology (XLK) - have actually just broken above their 200-day moving averages. Bespoke said: “This … signals the end to a long-term downtrend and the confirmation of an uptrend. It’s also a positive for the overall market that two cyclical sectors (one that is extremely tied to the consumer) are the first ones to break above their 200-days.”
Still talking technical analysis, Kevin Lane of Fusion IQ said: “The S&P 500 Index had stalled at the 878 level on three separate occasions over the past five months. However, prices then subsequently gave way to profit-taking and closed back below that level. Only a close above that level would open the way to higher prices.
“On the sentiment front, the CBOE Equity Put/Call Ratio, the AAII Bearish Sentiment Survey and the VIX’s deviation from its 50-day moving average have all moderated from constructive levels to more neutral levels. … these indicators are not at levels that would suggest sentiment is overly bullish yet, but their deterioration is enough cause for concern that a corrective wave may occur.”
“All the things are in place for the bear market to have ended,” Anthony Bolton, president of investments at Fidelity International in London, said in an interview with Bloomberg Television. “When there’s a strong consensus, a very negative one, and cash positions are very high, as they are at the moment, I’d like to bet against that.”
Remaining across the pond, David Fuller (Fullermoney) put matters in context as follows: “Base formations, confirming not only the ending of a bear market but the beginning of a new bull market, come in all shapes and sizes. The leading stock markets, which generally have better fundamentals, usually form smaller bases before commencing their uptrends, as we have seen with China and a number of other emerging markets from Asia to South America. Fundamentally weaker markets, such as the US and most of Europe, require a longer convalescence before a significant recovery occurs. This explains the new lows in late February and early March.
“This impressive rally is overextended in the short term, so we can expect it to spill over into a reaction and consolidation before long. The recent uptrend consistency will be followed by some choppy action as legitimate fundamental concerns remain.”
The last (cautionary) word goes to Richard Russell, writer of the Dow Theory Letters newsletter: “On the bear market decline, we never saw the great values that usually appear at major bear market bottoms. The ‘great value’ area is the place where I would normally suggest that investors load up with blue-chip stocks. For this reason, I would prefer waiting out this rally or making a limited trade with DIAs [Dow Diamonds ETF] with stops. I continue to believe this is an upward correction in an ongoing primary bear market. I note that many observers are saying that ‘this is a market that won’t go down’. Believe me, all markets go up - and all markets go down.”
And here is the venerable R man taking the bull by the horns!

For more discussion about the direction of stock markets, also see my recent posts “Video-o-rama: Investors “look past the valley“, “Sell in May and go away: Fact or fallacy?” and “Donald Coxe - Investment recommendations (April 2009)” (And also make a point of listening to Coxe’s webcast of May 1, which can be accessed from the sidebar of the Investment Postcards site.)
Economy “Global business sentiment is improving. Confidence remains very weak, but it improved last week to its best level since late last October. Much of the improvement has been in Asia and South America, although sentiment is more upbeat everywhere. Expectations regarding the outlook six-months hence are particularly buoyant,” said the latest Survey of Business Confidence of the World conducted by Moody’s Economy.com.
Although it is premature to conclude that the global recession is ending, a number of indicators, compiled by US Global Funds, could signal better times ahead.
• The inflation-adjusted inventory component of US GDP dropped by more than $100 billion in the first quarter of 2009. This figure represents nearly 1% of GDP. Such drops in the past have been associated with the end of recessions. At the least, it raises the chances of GDP growth in the current quarter.
• The latest industrial production (IP) numbers coming from Asia are positive. South Korea’s IP was up 5.2% from February, while Thailand’s IP improved by 2.5% and Japan’s gained 1.6%. Manufacturing inventories in South Korea and Japan continued their decline in March after peaking in late 2008.
• In China, the Purchasing Managers Index (PMI) rose for the fifth straight month in April (see blue line in chart below). The latest PMI figure is 53.5 - any reading over 50 indicates that the manufacturing sector is growing. The last time the PMI was this high was in May 2008. Another promising PMI figure, the employment sub-index, is also over 50, meaning that job growth in manufacturing is under way.
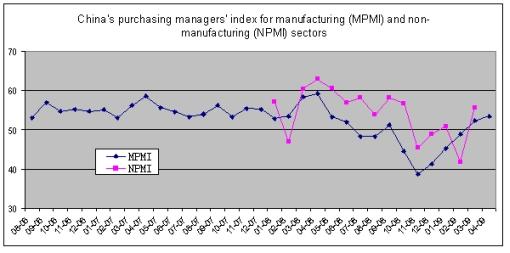
Source: Kevin, Sinolise.com, May 1, 2009.
The April update of the ISM Manufacturing Index shows that the US manufacturing sector failed to grow for the fifteenth straight month, but the April reading of 40.1 was significantly higher than the 36.3 figure for March. The index has been improving for four straight months.
Rebecca Wilder (News N Economics) summarized the global economic picture as follows: “Overall, hope that key economies are no longer in free fall is emerging; however, the economic decline is ongoing.”
In an interview with The Washington Post, Nouriel Roubini said: “I don’t believe we are going to end up in a near-depression. Six months ago I was more worried about an L-shaped near-depression. Today, after the very aggressive policy actions taken by the US and other countries … we are, instead, in the middle of a U.”
Turning specifically to the US, a snapshot of the week’s economic data is provided below. (Click on the dates to see Northern Trust’s assessment of the various data releases.)
May 01 • The ISM Manufacturing Survey points to imminent economic recovery, possibly in 2009 • Auto sales edged down in April
April 30 • Consumer spending and income decline • Initial Jobless Claims declined but Continuing Claims advanced
April 29 • Federal Open Market Committee (FOMC) meeting ends with no surprises • GDP growth - another quarter of deep and wide contraction in economic activity
April 28 • Case-Shiller Home Price Index confirms message from other reports • Consumer Confidence Index improves mostly on surge in Expectations Index
The FOMC announced no change to monetary policy on Wednesday following the conclusion of its meeting. The communiqué said the Committee expected to keep the Fed funds rate target in the 0-0.25% range “for an extended period”. Moody’s Economy.com reported as follows: “The remarks on current economic conditions were less pessimistic than in recent months; the statement said that the pace of economic contraction ‘appears to be somewhat slower’ and that ‘the economic outlook has improved modestly’ since March.”
The FOMC included the following paragraph in the statement regarding its programs to buy agency debt, mortgage-backed securities and Treasuries: “The Committee will continue to evaluate the timing and overall amounts of its purchases of securities in light of the evolving economic outlook and conditions in financial markets.”
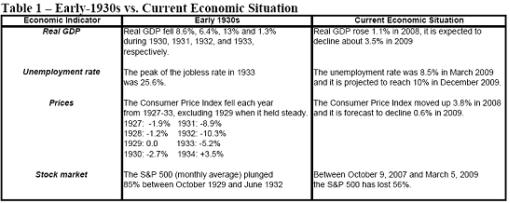
The dire tone of GDP growth in the last two quarters has invariably caused analysts to draw comparisons with the Great Depression. The table below, courtesy of Asha Bangalore (Northern Trust) compares the behavior of real GDP, unemployment, inflation and stock prices during the early-1930s with the current situation.
Click the table below for a larger image.
On the eve of the Berkshire Hathaway annual shareholders’ meeting in Omaha, Warren Buffett told CNBC that September’s “strike against the heart of the American system” was behind us, and that we have moved past the “economic Pearl Harbor”.
Week’s economic reports Click here for the week’s economy in pictures, courtesy of Jake of EconomPic Data.
Source: Yahoo Finance, May 1, 2009.
In addition to Fed Chairman Ben Bernanke’s testimony before the Joint Economic Committee in Washington (Tuesday, May 5) and interest rate announcements by the bank of England and the European Central Bank (both on Thursday, May 7), the US economic highlights for the week, courtesy of Northern Trust, include the following:
Click here for a summary of Wachovia’s weekly economic and financial commentary.
Markets
The performance chart obtained from the Wall Street Journal Online shows how different global financial markets performed during the past week.
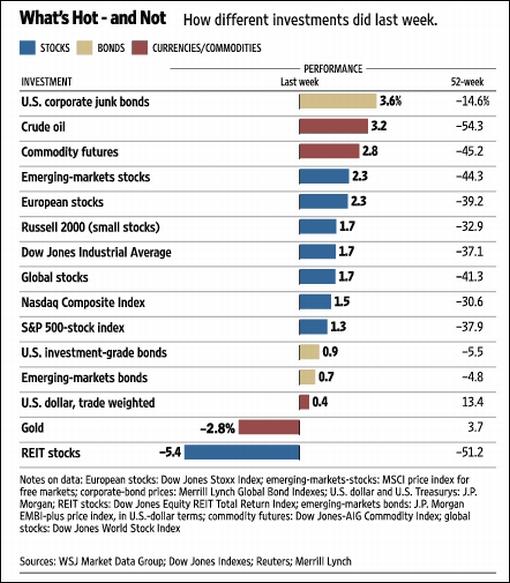
Source: Wall Street Journal Online, May 1, 2009.
J. Kenfield Morley said: “In investing money, the amount of interest you want should depend on whether you want to eat well or sleep well.” Hopefully the “Words from the Wise” reviews will assist Investment Postcards readers in properly assessing risks before making investment decisions.
Our thoughts are with those affected by the swine flu virus, and we pray that the spreading is contained. By the way, an interesting way of tracking the occurrences of the virus is by means of Google Maps (click on “Satellite” along the horizontal menu bar for the best image).
That’s the way it looks from Cape Town (yes, I’m actually back home for a change!).
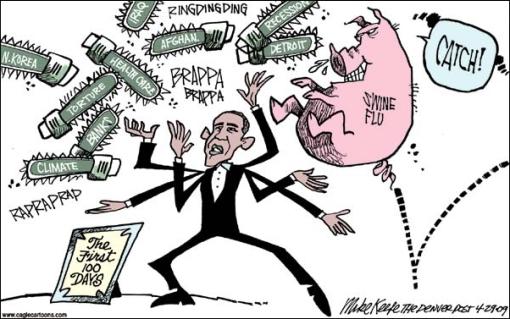
Source: Mike Keefe, The Denver Post.
Financial Times: Bank objections delay stress tests “US regulators will delay the release of stress test results for the country’s 19 biggest banks until next Thursday, after some lenders, including Citigroup and Bank of America, objected to government demands that they needed to raise billions in fresh capital.
“Citi, one of the biggest victims of the crisis that has already been bailed out three times by the government, is believed to have been told by regulators that it needs more than $5 billion in fresh capital, while BofA might need to convert $45 billion in government preferred shares into common equity.
“Both companies are still contesting the findings and might still persuade the government they need less, or no capital, according to people close to the situation. Citi’s own projections are believed to show the company will have hundreds of millions of dollars in excess capital.
“After a week of tense talks between regulators and the banks, government sources said the Treasury and the Federal Reserve were set to unveil the outcome of the tests after the market closes on May 7 - three days later than anticipated.
“The authorities’ decision to let the original timetable slip also reflects the widespread belief that, after months of speculation since the tests were first announced in February, their outcome has the potential to disturb the markets.
“Government sources said regulators were likely to release both aggregate and individual data for each of the 19 banks, detailing their losses and capital needs under adverse economic scenarios.
“Some of the banks will then supplement those data with regulatory filings and analysts’ calls. Bankers said a number of lenders had pleaded with regulators for more time to lay out plans to plug any capital shortfall identified in the stress tests, by raising equity from either the government or from the stock market.”
Source: Francesco Guerrera and Sarah O’Connor, Financial Times, May 1, 2009.
Option Armageddon: Stress test - tangible common equity “Ahead of official announcements regarding stress test results, OA thought we’d publish our latest update for banks’ tangible common equity, a metric that is likely to figure prominently.
“A recent Reuters report said ‘US regulators want the top 19 banks being stress-tested to have at least 3% [TCE].’ In other words, regulators want leverage ratios below 33x.* Surreal, no? That the banking system has grown so bloated that 33x leverage can be considered ‘healthy?’
“Anyway, using the 3% Test, the results for the nation’s nine largest banks are mixed … four pass, five fail. And by the way, this is before ‘stressing’ the balance sheet per future ‘adverse’ scenarios. As you can see, most banks fail the test before they even sit for it …
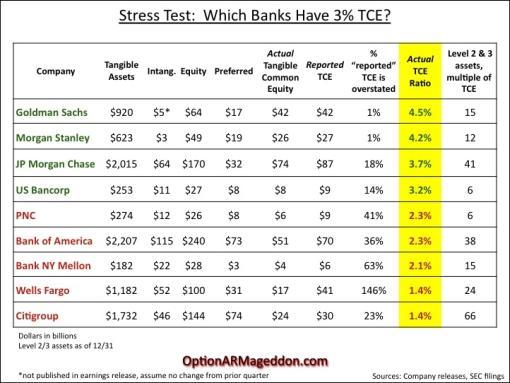
“To be clear, this is not a prediction of the government’s verdict. As Jack Ciesielski of The Analyst’s Accounting Observer points out: “there is no iconic definition of TCE. Treasury may come up with one of their own that takes into account ‘questionable items’ so that all the banks pass. That would be totally consistent with early reports …”
Source: Rolfe Winkler, Option Armageddon, April 24, 2009.
Financial Times: US taxpayers to take majority GM stake “US taxpayers would take a majority shareholding in General Motors under a sweeping debt-for-equity restructuring proposal that the carmaker revealed on Monday in a bid to avoid bankruptcy.
“Under the plan, GM said it would shut 13 of 47 plants by the end of next year, resulting in an additional 7,000 job losses. The latest job cuts would reduce GM’s US workforce from 61,000 last year to about 40,000 by the end of 2010.
“The carmaker, which lost its crown as the world’s biggest carmaker to Toyota last year, said it would give up its 83-year-old Pontiac brand and cut its dealership network from 6,200 to 3,600 by the end of 2010.
“Fritz Henderson, chief executive, said: ‘The objective here is not to survive. The objective is to develop an operating plan that allows us to win.’
“The Obama administration has set a June 1 deadline for GM to produce a viable turnaround plan in exchange for further government aid, or face bankruptcy. The carmaker has received $15.4 billion in emergency loans and expects the total to rise to about $20 billion by the end of next month.
“GM warned in a letter to bondholders that if the debt-for-equity swap failed to go through by June 1 it would ‘expect to seek relief through the US bankruptcy code’. In such circumstances, GM said bondholders might receive no ‘consideration at all’. GM set a May 26 deadline for bondholders to respond.
“Calling the proposal ‘neither reasonable nor adequate’, an ad hoc committee of GM bondholders said it believed ‘the offer to be a blatant disregard of fairness for the bondholders who have funded this company, and amounts to using taxpayer money to show political favouritism of one creditor over another’.”
Source: John Reed and Bernard Simon, Financial Times, April 27, 2009.
Financial Times: Chrysler files for Chapter 11 protection “Chrysler filed for Chapter 11 bankruptcy protection on Thursday after President Barack Obama criticized hedge funds for blocking an out-of-court restructuring of the US carmaker’s $6.9 billion debt.
“The Obama administration said the owner of Jeep and Dodge would emerge from a ‘surgical’ bankruptcy process with more government aid and new shareholders, including Italy’s Fiat and the United Auto Workers union. Bob Nardelli, Chrysler chief executive, will step aside as part of the deal.
“Mr Obama praised JPMorgan Chase and other large banks for accepting the terms of the proposed restructuring plan. He laid blame for the bankruptcy filing on ‘a small group of speculators’ who refused to buy into an offer to swap Chrysler’s debt for $2.25 billion in cash.
“They were hoping that everybody else would make sacrifices and they would have to make none,” he said. “Some demanded twice the return that other lenders were getting. I don’t stand with them.”
“Under the plan outlined on Thursday, Chrysler will face 30-60 days in Chapter 11, which enables businesses to restructure and reorganize under court supervision. During that period, Chrysler will close most of its North American plants, idling tens of thousands of workers.
“When Chrysler emerges from bankruptcy it will be 55% owned by the UAW and a separate workers’ healthcare trust. Fiat will take an initial 20% stake with the option of increasing it over time.”
Source: Tom Braithwaite and John Reed, Financial Times, April 30, 2009.
Charlie Rose: A discussion about Chrysler’s bankruptcy plan “A discussion about Chrysler’s bankruptcy plan with author Paul Ingrassia, Micheline Maynard, senior business correspondent for the New York Times and John Stoll of The Wall Street Journal.”

Source: Charlie Rose, April 30, 2009.
The Big Money: Dow Jones says it can measure economic sentiment by reading the press “Just as a technological revolution is blowing up newsrooms across the country, Dow Jones has come up with an algorithm to prove that yesterday’s newspapers are useful for more than just fish wrap. According to the publishing giant, you can plumb the language and tone of newspapers to finger turning points in the economy.
“The news, it seems, is a moderately reliable economic compass. And today, Dow is quantifying that assertion with the release of its newly minted Economic Sentiment Indicator, a monthly assessment of the ‘tone’ of content in 15 metropolitan dailies. The ESI, informally known as the Optimism Index, is a simple barometer based on a scale of zero to 100 - the higher the number, the more upbeat the news and, by extension, the stronger the economy. Dow Jones back-tested the indicator to 1990 and found that it could signal critical turning points in the economy, sometimes a bit earlier than other economic measures.”
Source: Nancy Miler, The Big Money, April 30, 2009.
Bespoke: Tracking the business cycle through Google trends “Google Trends is a cool tool that has been around for a few years that tracks search volume and news reference volume for various words and phrases. We like to use it as a sentiment gauge of the public. Below we highlight the Google Trends result for the word ‘recession’. As shown, there was a big spike at the start of 2008 when the economy began to stumble. Then it died down only to spike again in Q4 ‘08 when things got really bad. Over the last couple of months, however, the ‘recession’ worries seem to be dwindling again, but they are still elevated. It’s also interesting to note how little chatter there was about it in 2004, 2005, 2006, and 2007.”
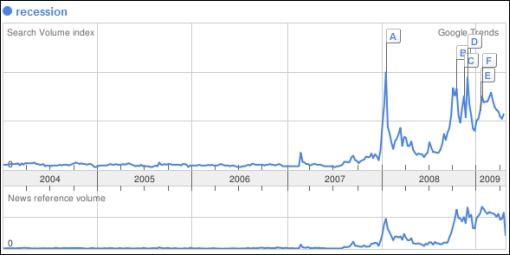
Source: Bespoke, April 30, 2009.
Charlie Rose: A conversation about the economy “A conversation about the economy with Bill Ackman, major investor and hedge fund manager of Pershing Square Capital Management LP, Kate Kelly of The Wall Street Journal, Andrew Ross Sorkin of The New York Times and Joseph Stiglitz, economist and a member of Columbia University faculty.”
Source: Charlie Rose, April 24, 2009.
CNBC: Buffett - “economic Pearl Harbor” is over “Billionaire investor Warren Buffett tells CNBC’s Becky Quick that this past September’s ‘strike against the heart of the American system’ is behind us, and that we have moved past the ‘economic Pearl Harbor’. However, he cautions that the war isn’t over just yet.”
Source: CNBC, May 1, 2009.
CNBC: Munger on Berkshire’s off year “Berkshire vice chairman Charlie Munger discusses Berkshire’s difficult year and where he thinks the economy is headed, with CNBC’s Becky Quick.”
Source: CNBC, May 1, 2009.
The Washington Post: Roubini - “I am not Dr. Doom” “Lally Weymouth of Newsweek and The Post sat down last week with economist Nouriel Roubini. Excerpts:
“Q. You are the economist known for predicting the economic downturn in 2008. What do you believe is happening to the economy today?
“A. The consensus among economists is that they see the economy that was contracting for the last two quarters at 6% going into positive economic growth by the second half of this year … I believe that the rate of economic contraction is going to slow from negative 6% in the last two quarters to negative 2% by the fourth quarter.
“Next year, I believe that the growth rate is going to be low - 0.5% for the US, compared to the consensus view of [plus] 2%. I believe the unemployment rate this year is going to go well above 10% and will be well above 11% next year, so even if we are technically out of a recession, we are going to feel like we are in a recession.
“I do agree that there is an improvement in the sense that the rate of contraction is not going to be as much as it has been in the last couple of quarters, but I still believe that the bottom of the economy [will be seen] toward the beginning or middle of next year. So my views are more bearish than the consensus.
“I believe things are going to be very mediocre throughout the world; in particular, in Europe and in Japan. They will only get out of their recession toward the end of next year.
“So you are still Dr. Doom?
“No, I am not Dr. Doom. I am Dr. Realist. I don’t believe we are going to end up in a near-depression. Six months ago I was more worried about an L-shaped near-depression. Today, after the very aggressive policy actions taken by the US and other countries … we are, instead, in the middle of a U.”
Click here for the full article.
Source: Lally Weymouth, The Washington Post, April 27, 2009.
Paul Kasriel (Northern Trust): Coming out of the downturn “Paul Kasriel, Northern Trust’s Chief Economist, discusses the current economic climate and the potential impact on market consumption during any recovery.”

Source: Paul Kasriel, Northern Trust, April 30, 2009.
CNBC: Sheila Bair - the economy & financial crisis “FDIC Chair Sheila Bair discusses the current state of the economy and the financial crisis.”
Source: CNBC, April 27, 2009.
CEP News: Fed keeps target rate and asset purchases unchanged “The US Federal Reserve maintained the status quo on Wednesday. It kept rates unchanged, as expected, and maintained the amount of Treasuries, mortgage-backed securities and government sponsored enterprise (GSE) assets it intends to purchase.
“The Fed said it will evaluate the timing and amount of future asset purchases over time, and that the vote to keep the program as is was unanimous.
“In the monetary policy statement, the central bank said there are some signs that the economic outlook is improving, including stabilization in consumer spending and a slower pace of economic contraction.
“‘Although the economic outlook has improved modestly since the March meeting, partly reflecting some easing of financial market conditions, economic activity is likely to remain weak for a time,’ the statement read.
“Nevertheless, the Fed said the US will eventually resume a sustainable economic growth path.
“The Fed said it will employ all available tools to promote a recovery. As of the last meeting, the Fed plans to spend up to $1.25 trillion on agency mortgage-backed securities, up to $2,900 billion in agency debt and up to $300 billion in Treasury securities.”
Source: CEP News, April 29, 2009.
Asha Bangalore (Northern Trust): Another quarter of deep and wide contraction in economic activity “Real gross domestic product (GDP) fell at an annual rate of 6.1% in the first quarter of 2009 after a 6.3% drop in the fourth quarter of 2008. Real GDP has declined at an annual rate of 6.2% in the last two quarters, which is the largest since the 1957:Q1-1958:Q2 period when the annualized reduction in real GDP was 7.4%.
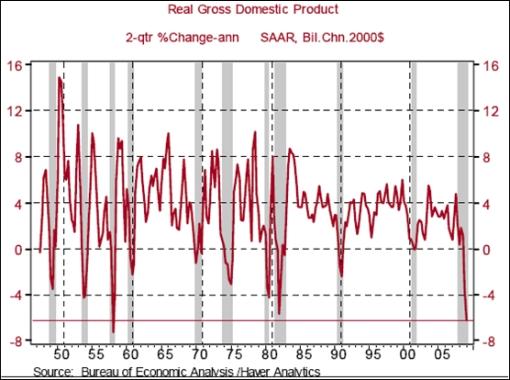
“A decline in real GDP, albeit more modest, is projected for the second quarter. GM’s plans to cut production should translate into another noticeably weak third quarter headline for real GDP, followed by a stronger than previously expected fourth quarter. The annual decline in real GDP is now projected to be roughly 3.5% in 2009, which is a tad higher than the 3.3% decline assumed in the alternative adverse scenario of the stress test of the 19 major banks under the Treasury’s Capital Assistance Program.”
Source: Asha Bangalore, Northern Trust - Daily Global Commentary, April 28, 2009.
Asha Bangalore (Northern Trust): ISM Manufacturing Survey points to imminent economic recovery, possibly in 2009 “The April survey results of the ISM Manufacturing Survey results indicate that the factory sector is contracting but the pace of contraction has slowed significantly. The composite index (PMI) rose to 40.1 in April from 36.3 in March. Indexes below 50.0 denote a contraction in activity but indexes moving toward 50.0 imply a deceleration in the pace of factory activity. The cycle low for the composite index is the December 2008 reading of 32.9.”
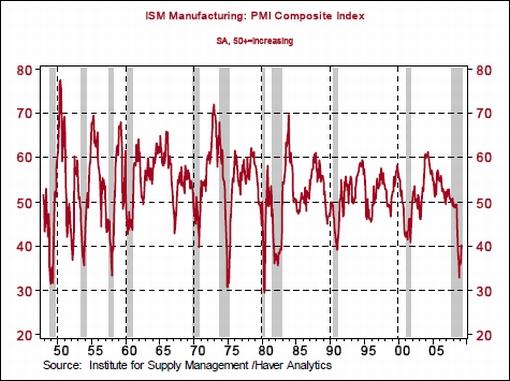
Source: Asha Bangalore, Northern Trust - Daily Global Commentary, May 1, 2009.
By Dr Prieur du Plessis
Dr Prieur du Plessis is an investment professional with 25 years' experience in investment research and portfolio management.
More than 1200 of his articles on investment-related topics have been published in various regular newspaper, journal and Internet columns (including his blog, Investment Postcards from Cape Town : www.investmentpostcards.com ). He has also published a book, Financial Basics: Investment.
Prieur is chairman and principal shareholder of South African-based Plexus Asset Management , which he founded in 1995. The group conducts investment management, investment consulting, private equity and real estate activities in South Africa and other African countries.
Plexus is the South African partner of John Mauldin , Dallas-based author of the popular Thoughts from the Frontline newsletter, and also has an exclusive licensing agreement with California-based Research Affiliates for managing and distributing its enhanced Fundamental Index™ methodology in the Pan-African area.
Prieur is 53 years old and live with his wife, television producer and presenter Isabel Verwey, and two children in Cape Town , South Africa . His leisure activities include long-distance running, traveling, reading and motor-cycling.
Copyright © 2009 by Prieur du Plessis - All rights reserved.
Disclaimer: The above is a matter of opinion and is not intended as investment advice. Information and analysis above are derived from sources and utilizing methods believed reliable, but we cannot accept responsibility for any trading losses you may incur as a result of this analysis. Do your own due diligence.
Prieur du Plessis Archive |
© 2005-2022 http://www.MarketOracle.co.uk - The Market Oracle is a FREE Daily Financial Markets Analysis & Forecasting online publication.