


Gold and Silver Bearish Trend Continues
Commodities / Gold & Silver 2009 May 03, 2009 - 08:02 AM GMTBy: Merv_Burak

 Another down week for the precious metals. Neither gold nor silver seem to be able to get any steam behind their moves. Maybe there is still more down side to come. Let’s see if that 200 day moving average will hold.
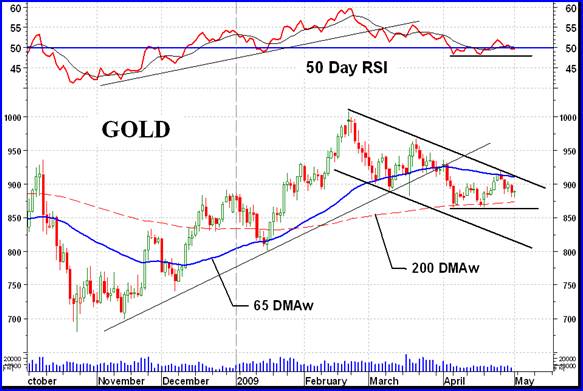
GOLD LONG TERM
Interesting phenomena with the 200 day moving average line. The simple average line has turned downward even though the price of gold remains above the line. This is probably the result of the removal of the data 201 days ago and replaced by the data today, with both events given equal weight towards the calculation of the moving average. Using the weighted moving average line the more recent data is given greater weight towards the calculation of the moving average and the line slope remains positive.
Since issuing a bear signal the long term point and figure (P&F) chart has set up a support at the $870 level. $855 would be a new bear low for this latest trend. However, the chart has also set up a pattern that could cause the P&F to reverse itself and go back into a long term bull mode. At this time that would require a move to the $930 level and give us an initial projection to $1050. For now we’ll just have to wait and see which way the wind is blowing and which direction the price will take. For now the bear projection remains to the $705 level.
As for what the normal indicators are telling us, well they are not yet bearish as is the P&F chart. The gold price remains above its positive sloping (weighted) moving average line although it is heading towards the line. The momentum indicator remains just above its neutral line in the positive zone but just below its negative trigger line. The volume indicator is showing more weakness and remains below its negative sloping trigger line. As far as the normal trend and strength indicators are concerned the long term rating remains BULLISH for now.
INTERMEDIATE TERM
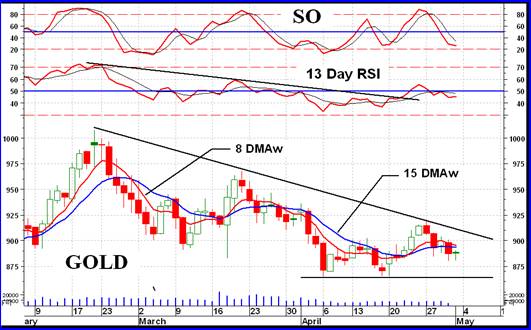
Very often trend and support/resistance lines in momentum indicators are more accurate or provide earlier signals than they do in the price charts. An example is seen in the chart here. The up trend line in the momentum indicator was broken a month before the gold price up trend line. Not drawn but a down trend line on the momentum indicator has already been broken. Are we in for an upside break in the price?
The gold price continues to show weakness and especially when combined with the very low volume activity. Although a clear support is shown in the price (and momentum) one starts to wonder about its viability. Questions, questions!
Going through the routine we see that the recent price action continued below the intermediate term moving average line and the line slope continues downward. The momentum indicator is playing around with its neutral line and closed the week just below the line in its negative zone. It is also just a shade below its negative trigger line. For now the action remains inside that intermediate term down trending channel. What can I say but that the intermediate term rating is BEARISH, at this time. With the price action trapped between both moving average lines one has to give.
SHORT TERM
Short term it looks like we are going through a little period of negative trend. It might still go a little lower but here’s hoping it stops above the support. With the price below its negative moving average line and the momentum indicator in its negative zone about the only non-confirmation we have of a negative trend is the very short term moving average line. It has not yet crossed the short term line on the down side but is closing the gap fast. The short term must be thought of as BEARISH at this time.
As for the direction of least resistance, that would be to the down side although there is some indication during Friday’s action that it might turn around.
SILVER
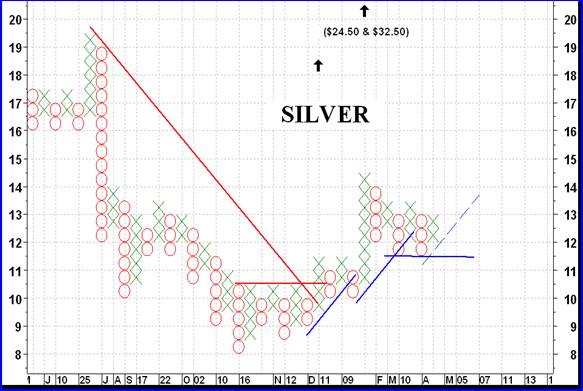
Unlike gold the silver P&F chart has not yet given us a bear signal. That would take a move to $11.50 for the signal to be given. In the mean time from the previous action we do have 3 projections shown on the chart. The initial projection, and the one most likely to be reached, is the one to the $18.50 level. We have two additional projections, to $24.50 and $32.50. We’ll see how things go. It would not be unusual if silver reversed direction for a while before continuing to those higher projections so one should not worry too much if we do have a reversal of trend. Should such reversal carry into new lows, then one should worry. Of course, if you are trading silver or silver stocks one would not be holding on during a down trend but sell and get back in when the trend reverses.
As for what the normal indicators are telling us, well they are telling us a more complicated story. On the long term although silver is above its positive moving average line the momentum is already in its negative zone below its negative trigger line. We have a long term rating set at + NEUTRAL, going towards bearish.
On the intermediate term, as with gold, the price is below its negative moving average line and the momentum indicator is just inside its negative zone, below its negative trigger line. The rating here is BEARISH.
On the short term the most encouraging indicator is the daily volume action. It is much better and positive than the gold volume action. It seems that speculators are placing more emphasis on a silver recovery than a gold one. Something to think about in playing the stock market. Although the short term indicators are all negative I would be inclined to give the short term a NEUTRAL rating due to the volume action.
PRECIOUS METAL STOCKS
It hasn’t been a good week for stocks with most of the major North American Indices showing declines in the order of 5%, give or take a % or so. The Merv’s Indices showed what was happening. The “quality” sector took the brunt of the decline with the Merv’s Qual-Gold Index losing 4.0%. Overall, the universe of 160 stocks did a lot better with an average decline of only 1.2%. There seems to be a battle week to week between the “quality” stocks and the speculative or cats and dogs. They seem to alternate as to which one moves up or down.
Checking further how the stocks did this week I see that there were 53 stocks on the advance (33%) but twice as many on the decline, 100 stocks (63%). So, maybe the speculative stocks didn’t have such a good week, only their decline % must have been less than for the biggies. One of the information provided to my subscribers is the weekly list of those stocks that had changed their basic intermediate term bullish or bearish rating during the week. Although there were only a few stocks changing their rating this week it is interesting to note that only 29% of the stocks last had bullish ratings while 71% of the stocks had bearish ratings. Not a very good ratio. Of course, that means that should the trend perk up again there are a whole lot of stocks that still have a lot of upside potential. In the mean time one would be sitting on the sidelines.
Merv’s Precious Metals Indices Table
Well, I’ll call it another week.
By Merv Burak, CMT
Hudson Aero/Systems Inc.
Technical Information Group
for Merv's Precious Metals Central
For DAILY Uranium stock commentary and WEEKLY Uranium market update check out my new Technically Uranium with Merv blog at http://techuranium.blogspot.com .
During the day Merv practices his engineering profession as a Consulting Aerospace Engineer. Once the sun goes down and night descends upon the earth Merv dons his other hat as a Chartered Market Technician ( CMT ) and tries to decipher what's going on in the securities markets. As an underground surveyor in the gold mines of Canada 's Northwest Territories in his youth, Merv has a soft spot for the gold industry and has developed several Gold Indices reflecting different aspects of the industry. As a basically lazy individual Merv's driving focus is to KEEP IT SIMPLE .
To find out more about Merv's various Gold Indices and component stocks, please visit http://preciousmetalscentral.com . There you will find samples of the Indices and their component stocks plus other publications of interest to gold investors.
Before you invest, Always check your market timing with a Qualified Professional Market Technician
Merv Burak Archive |
© 2005-2022 http://www.MarketOracle.co.uk - The Market Oracle is a FREE Daily Financial Markets Analysis & Forecasting online publication.