


Weekly Gold and Silver Technical Analysis Report - 20th May 2007 - Technically Precious with Merv
Commodities / Gold & Silver May 20, 2007 - 11:09 AM GMTBy: Merv_Burak

Wednesday was a decisive downside break below a 7 month up trend line. Is this the start of a new BEAR or is it just a continuation of a wide year long lateral trend?
SOME SURPRISING STATISTICS
This past Wednesday I had the pleasure of making a telecom presentation to the Calgary Chapter of the Canadian Society of Technical Analysts. The Topic was “GOLD – Invest/Speculate/Gamble, Decisions, Decisions”. I wouldn't go into the presentation here but I thought that you might be interested in some of the statistics that I had come up with in the process of putting the presentation together. The statistics involved a review of the performance of various Gold Indices over the past 11 years, encompassing one major bear and one major bull market. The Indices reviewed were grouped into their “quality” sectors of QUALITY, SPECULATIVE and GAMBLING. These were:
QUALITY INDICES: PHLX Gold & Silver Sector Index , Merv's Qual-Gold Index
SPECULATIVE INDICES: AMEX Gold BUGS Index , Merv's Gold & Silver 160 Index , Merv's Spec-Gold Index
GAMBLING INDEX: Merv's Gamb-Gold Index
It should be noted that the Merv's Gamb-Gold Index was developed in the year 2000 and therefore data during the bear market of 1996 to 1998/2000 was unavailable (but is thought to be similar to the performance of the Merv's Gold & Silver 160 Index). As we know, the PHLX and AMEX Indices are a function primarily of the largest few component stocks while the Merv's Indices are equal weight Indices reflecting the average performance of all component stocks.
Also noted is that the statistics are to the close of trading on Friday, 11 May 2007 .
Different time periods were reviewed during this 11 year period and similar statistics were shown for each comparison. I'll just give you some of the highlights.
BEAR MARKET LOSSES (from 1996 top to 1998/2000 low)
GOLD - 38.8%
QUALITY LOSSES: PHLX Gold & Silver Index - 72% , Merv's Qual-Gold Index - 68%
SPECULATIVE LOSSES: AMEX Gold BUGS Index - 83% , Merv's Gold & Silver 160 Index - 63% , Merv's Spec-Gold Index - 79%
BULL MARKET GAINS (from 1998/2000 low to 11 May 2007 )
GOLD + 191%
QUALITY GAINS: PHLX Gold & Silver Index + 234% , Merv's Qual-Gold Index + 570%
SPECULATIVE GAINS: AMEX Gold BUGS Index + 821% , Merv's Gold & Silver 160 Index + 6356% , Merv's Spec-Gold Index + 3810%
GAMBLING GAINS: Merv's Gamb-Gold Index + 7548%
As mentioned, looking at other shorter time periods we get similar results, losses about equal for all sectors but gains dramatically different. One last statistic:
BUY AND HOLD FOR LONG TERM (from top of Index in 1996 to 11 May 2007 )
QUALITY: PHLX Gold & Silver Sector Index loss of 8%
SPECULATIVE: Merv's Gold & Silver 160 Index gain of 1957%
Now, I have a question for the “ buy quality and hold for the long term ” investor. If the bear market losses are about the same for quality stocks as they are for the speculative stocks, and if the gains are so much more dramatic in the speculative stocks versus the quality stocks during a bull market, WHY ARE YOU IN THE QUALITY STOCKS?
Of course, statistics are what one makes of them but I thought I'd just put these out there for information.
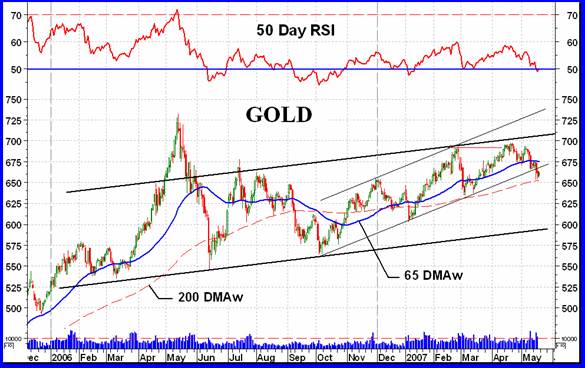
GOLD : LONG TERM
Looking at the long term P&F chart we are still a long way from a reversal to the bear side. At the present time we would need a move to the $600 level to turn bearish (although that could change with subsequent new up and down activity). Even using the old $10 unit, 2 unit reversal chart would require a move to $630 so for now the P&F charts are still in the bullish camp.
The end of week activity in the gold price has been taking place just above my long term positive moving average line. The real weak indicator is, however, the long term momentum indicator. It is still in its positive zone but is at a level lower than the previous March low and just about at the Jan low. This negative action versus the price itself is suggesting that the odds are for further weakness ahead in the price. The volume indicator is now below its long term trigger for a negative reading, however, the trigger is still pointing very slightly upwards so the negative is somewhat softened.
Although none of the indicators or charts have gone bearish on the long term yet they have weakened to the extent that I am lowering my rating on the long term from bullish to + NEUTRAL.
INTERMEDIATE TERM
The intermediate term P&F chart has gone bearish with an initial price projection of $605. That would take us back to the low of early Jan but just on top of the long term P&F break-out point. Along the way I'm sure there will be other projections that will be activated, some will be met and others I can safely say will not be, but that's the forecasting game.
The chart shows a long term wide and slightly upward sloping lateral trend that goes back to early 2006. With the break below the recent secondary channel we may be heading back to the lower levels of this trend. If that move takes a month or two then the lower support line will be at the P&F projection level of $605. Sounds like a good number for now.
The price is now below its intermediate term moving average line and the line has definitely turned downward. The intermediate term momentum has a similar negative divergence versus price action as mentioned for the long term. It is in its negative zone, it is below its level from the March low and it\s closing in on its Jan low. The volume indicator is well below its trigger line and the trigger line has turned down.
With the P&F gone bearish and all the indicators are negative I can only go BEARISH on the intermediate term.
SHORT TERM
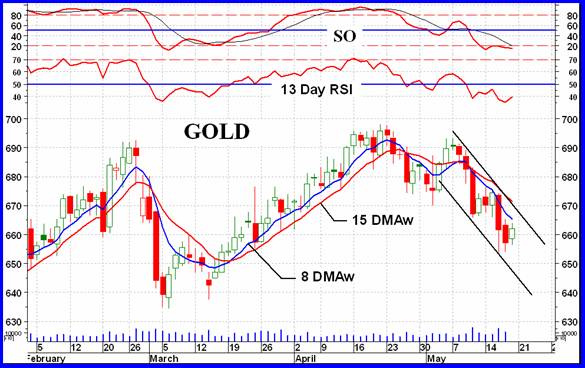
Well, the short term has gone into a decline that looks like it might continue for a while yet. The price action is below a now well established negative moving average line (15 DMAw) and momentum is into its negative zone. The short term momentum (13 Day RSI) is some distance above its oversold line so that there is still room for more down side. The action is now also trapped inside a down trending channel. At the present time I don't see the short term reversing unless the price quickly moves to the $677 level, at which point the moving average and momentum will probably turn positive and the channel broken.
IMMEDIATE TERM
Although the Stochastic Oscillator seems to be firming up with the Oscillator line and trigger moving average line coming closer together I don't see this as yet a reversal of trend but more like what we had in early March. By continuing to follow the very short term moving average line one was mostly right as to the next day's action. One is only wrong a few times in the past few months. So I will go with that and consider the next days as being negative days. Should the price close above $666 then that might signal a change in immediate term direction.
NORTH AMERICAN GOLD INDICES
Well, we're back to the PHLX Gold & Silver Sector Index for this week's look at the majors.
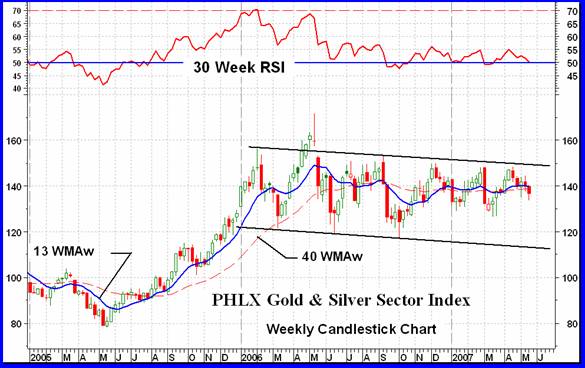
In my review of Indices for my presentation mentioned at the beginning of this commentary the PHLX Index came off very badly in the comparisons. Unfortunately, it is the most common Index used by the media and most commentators and analysts to represent what's happening with gold stocks. Readers of these commentaries know to look elsewhere for information on the actions of gold stocks, and it ain't the major Indices.
Anyway, the PHLX Gold Index continues to be trapped within a wide channel similar to gold itself except that the gold channel is sloping slightly upward and the PHLX is sloping slightly downward. It has been many months now since it was last in the lower portion of the channel. This might be the move that takes it there once more, although we have had several of these minor downside reactions.
Long term investors should continue to remember that this Index is still below its 1996 top despite a 6/7 year bull market.
MERV'S PRECIOUS METALS INDICES
About a month ago I showed the Merv's Composite Index of Precious Metal Indices which suggested that the Composite Index was reacting from a level that would make it a perfect double top. The reaction continues. Although for a double top to be validated the Index must close below the lowest previous low in the period between tops. That is still a long way off but the long term momentum indicator is very close to moving below its low of the same period, and that would place the momentum in the negative zone if it did so. As with most gold Indices, the Composite Index has gone BEARISH on the intermediate term. Can the long term be far away?
MERV'S GOLD & SILVER 160 INDEX
With a loss on the week of 3.5% the universe did slightly worse than the major North American Indices (except for the S&P/TSX Global which lost 3.7%). A look at the sector Indices and one can determine that the greater losses were in the more speculative or gambling variety of stocks. Despite the loss the universe is still doing quite well versus any of the major North American Indices. Although the weekly % Index loss does not seem that bad the overall breadth of the Index was bad. Only 18% of the stocks advanced during the week while 79% declined. The overall summation of individual stock ratings also moved decisively towards the negative. We are now at a short term BEAR of 77%, an intermediate term BEAR at 66% but at a NEUTRAL rating for the long term with neither the bull or bear having 50% or more.
On the intermediate term the Index has dropped below its moving average and the average just turned slightly downwards. Although the momentum indicator is still above its neutral line it is heading quite rapidly towards the negative. All in all, the intermediate term may be classified as BEARISH.
On the long term everything is still positive although greatly weakened and moving towards the negative. The long term can only be declared as + NEUTRAL, at best although the table still has it as POS.
MERV'S QUAL-GOLD INDEX : MERV'S SPEC-GOLD INDEX : MERV'S GAMB-GOLD INDEX
It is starting to look real bad for the various sector Indices. As can be expected all were in the loss side of the market with the least loss in the Qual-Gold and the worst in the Gamb-Gold. The Spec-Gold held the mid ground. The advancing versus declineing issues were pretty bad too. The Qual-Gold had 17% advancing and 83% declining. The Spec-Gold had the same while the Gamb-Gold did a little better but not much, with advances at 27% and declines at 73%. As one might expect, all the summation of individual ratings moved towards the negative side. The short/intermediate/long term ratings are as follows: Qual-Gold at BEAR 82%, BEAR 77%, BEAR 58%. Spec-Gold at BEAR 73%, Bear 70% and NEUTRAL. The Gamb-Gold had BEAR 80%, BEAR 65%, BEAR 53%. Not a good showing. MOST stocks are in the dumper.
As for the charts and indicators, the intermediate term ratings in the table conform with the charts and indicators , however, I have a slight difference of opinion on the long term ratings. I see the long term Qual-Gold rating as – NEUTRAL and the long term Spec-Gold as POS. No argument about the long term table rating for Gamb-Gold.
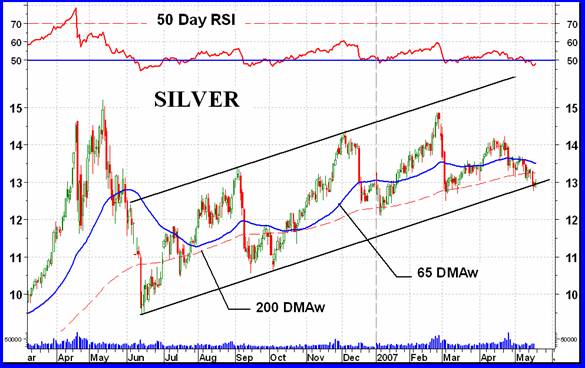
SILVER
Silver looked like it was the stronger of the two metals (gold being the other one). Over the past year we had both in up trending channels but silver had the more aggressive channel. Now that it looks like the metals are having a good reaction, maybe even a reversal, it's the silver price that is breaking below its lower support first. We had a break but it's holding just about at the line. However, the intermediate term momentum indicator has crossed its neutral line and has moved below its previous Jan low on its way below the June 2006 low. Things do not look good at the present time for silver. Maybe it will turn around and rally as it has done a few times in the past. There is one difference this time, the down turn did not come from a new rally high but from a lower high.
MERV'S QUAL-SILVER INDEX : MERV'S SPEC-SILVER INDEX
As one can expect the two Silver Indices were down on the week with the Spec-Silver down 4.8%, the worst showing of any of the table Indices. It was also the worst in the breadth category with only 8% of the stocks advancing and 88% declining on the week. The Qual-Silver was better at 20% advancing and 80% declining but with only 10 component stocks there were only 2 advances. All of the summation of individual stock ratings are in the bearish camp except for the long term Qual-Silver rating which is neutral.
As for the charts and indicators, they are in agreement with the table, however, the long term ratings differ somewhat. The table uses a slightly more aggressive long term moving average in its calculations and therefore the ratings change slightly faster than what I get from the charts. I have both Indices as still POS on the long term. This could change quickly should we continue lower.
MERV'S PRECIOUS METALS INDICES TABLE
So much for this week.
By Merv Burak, CMT
Hudson Aero/Systems Inc.
Technical Information Group
for Merv's Precious Metals Central
Web: www.themarkettraders.com
e-mail: merv@themarkettraders.com
During the day Merv practices his engineering profession as a Consulting Aerospace Engineer. Once the sun goes down and night descends upon the earth Merv dons his other hat as a Chartered Market Technician ( CMT ) and tries to decipher what's going on in the securities markets. As an underground surveyor in the gold mines of Canada 's Northwest Territories in his youth, Merv has a soft spot for the gold industry and has developed several Gold Indices reflecting different aspects of the industry. As a basically lazy individual Merv's driving focus is to KEEP IT SIMPLE .
To find out more about Merv's various Gold Indices and component stocks, please visit www.themarkettraders.com and click on Merv's Precious Metals Central . There you will find samples of the Indices and their component stocks plus other publications of interest to gold investors. While at the themarkettraders.com web site please take the time to check out the Energy Central site and the various Merv's Energy Tables for the most comprehensive survey of energy stocks on the internet. Before you invest, Always check your market timing with a Qualified Professional Market Technician
© 2005-2022 http://www.MarketOracle.co.uk - The Market Oracle is a FREE Daily Financial Markets Analysis & Forecasting online publication.