


Stock Market Counter Trend Rally Suggests Short-term Double Top Pattern
Stock-Markets / Stocks Bear Market May 03, 2009 - 05:28 PM GMTBy: Andre_Gratian

 Current Position of the Market
SPX: Long-term trend - Down! The very-long-term cycles have taken over and if they make their lows when expected, the bear market which started in October 2007 should continue until 2012-2014. This would imply
that much lower prices lie ahead.
SPX: Intermediate trend - On March 6, the index started a counter-trend rally of a corrective nature. Two weeks ago it looked as if we had reached a top, but today, we are at the same price; perhaps a double-top followed by a pause in the trend.
Analysis of the short-term trend is done on a daily basis with the help of hourly charts. It is an important adjunct to the analysis of daily and weekly charts which determines the course of longer market trends.
Daily market analysis of the short term trend is reserved for subscribers. If you would like to sign up for a FREE 4-week trial period of daily comments, please let me know at ajg@cybertrails.com .
Overview:
Since a picture is worth etc…, we’ll start by showing a daily chart of the NASDAQ Powershares QQQQ Trust.
Would you rate this stock a buy or a sell? Well, let’s see! Let’s do some quick analysis:
1)The price is at the top of the intersection of 2 channels,
2) It has also reached its 200 DMA,
3) It has retraced 38.2% of it’s former move,
4) The O/B-O/S oscillator has been overbought for a month,
5) The momentum oscillator is showing negative divergence,
6) The price is making a wedge pattern, which consists of…
7) 3 completed sets of 5 waves each,
8) The A/D oscillator also shows strong negative divergence! (not shown here)
9) The Financial index is showing negative divergence to the rest of the indices! (not shown here)
So, I’ll let YOU make the decision. Is it a buy or a sell? Maybe a sell you say? OK, I’ll give you one more clue: There are a bunch of cycles bottoming between now and the middle of the month.
“SELL!”
Yup! There are plenty of good reasons for the rally from March 6 to reverse here. But what kind of a decline can we expect? On 4/17, it looked very much as if we were at a top and I pointed it out in the last Newsletter. The next day, the SPX tumbled 38 points! On Friday, 4/17, the SPX closed at 875. For the past 2 weeks, the index ground its way back to the same level, and last Friday closed at 877.52 -- the first time that it was able to close above 875! So, are we ready for another 38-point sell-off tomorrow?
I would not bet on it! The fact that we have been able to recover from such a dramatic drop instead of continuing to go down -- especially with a nest of cycles bottoming directly ahead of us -- indicates that there are larger cycles pushing up and softening the downward pressure of the smaller cycles.
What's ahead?
Chart Pattern and Momentum
Above is the weekly chart of the SPX. It looks very much like the one shown here two weeks ago.
The O/B-O/S indicator is still very overbought. As the price has moved higher, the index has moved down from100% overbought to 99.47%, which represents minuscule negative divergence, but perhaps the beginning of something ☺.
Expectations for the EW wave B and C of intermediate 4 have been modified. Because of the strength of the market and the prolonged nature of the rally, Wave B will be shorter than it would have been if we had started the decline with the plunge of 4/20.
We can skip the daily chart, since we have shown the QQQQ above. The charts and indicators are very similar except for the fact that the NDX is much stronger. I’ll comment on this in Market Leaders and Sentiment. Let’s go next to the hourly SPX (below).
On Friday’s close, the indicators and the price were mostly neutral. The index was supported, once again, by its major trend line (blue) which is also the 3rd fan line since the beginning of the rally. From March 6, it has been touched 6 times! Therefore a penetration to the downside should be meaningful.
There is no obvious divergence in the indicators, and the O/B-O/S index is near the low of its range, so there is a chance that we might have one more little wave up. But for this, we would need to open up on Monday morning above 881, and continue to move up right away. Any failure to move above the former top would probably lead to a reversal and to our first objective on the downside to 857.
As far as the EW count is concerned, I have no idea if I correctly labeled the short term, and certainly don’t know what the entire rally from 667 should be called! But combining the facts that we have a) 3 patterns of 5 waves ending last Thursday, b) the obvious resistance at the NDX current level, and c) cycles bottoming directly ahead, up (…err, down…) to the middle of May, I would not advise short-timers to buy, or even hold positions at this time. But then, I don’t advise, anyway
Cycles
The last Newsletter read: “The Armstrong cycle was obviously a top, and since it was slated to come between the 16th and the 19th, the 17th fits right in!”
Well, the short-term top in the market certainly fit in with the date, but there was no follow-through to the strong one-day decline. This was a sign that we made something other than a short-term low in early March, and that we are in the middle of a strong secondary reaction (bear market rally) of intermediate nature. Another sign is that all the cycles bottoming ahead of us have -- so far -- had no effect on market prices. Here is what I see for the first 3 weeks in May. These are theoretical lows! They can vary from the actual lows by a few days, especially in the longer cycles:
6-wk Cycle 5/8
7-mo 5/8
22-wk 5/13
10-wk 5/18
9-mo (not Hurst’s) 5/19
Projections:
Morning Comment to subscribers on 4/30
----- Original Message -----
From: Andre Gratian
Sent: Thursday, April 30, 2009 6:26 AM
Subject: Morning Comment
Thursday, April 30 Morning Comment
“Even though the markets sold off sharply at yesterday's close, after reaching our low 880s projection, we were left with a sense of incompletion. I would never bet that a move is over with 2000 A/D positive at the close. Expectations, therefore, were for one more little wave up to about 887-889 with much less positive A/D. This could be what we are doing this morning! Not only would this complete a 5-wave pattern from Tuesday's opening low of 847.12, but it could also complete a 5 of 5 of 5 from the March low of 667.”
If Thursday’s projection which was hit squarely on at 888 had been an important top, it seems to me that Friday would have been a much weaker day instead of bouncing once more from the main trend line.
We are dealing with subtleties here, but they could be important for refined timing. Closing above 875, should trigger another potential rally to 900. Notice that on both Wednesday and Thursday, the SPX went above 875 intra-day, but closed below. On Friday, we finally closed at 877.52 as a result of a sharp 4-point rally which came in the last 3 minutes of trading! Is this pure, meaningless, coincidence, or an attempt at keeping the rally going?
We’ll find out Monday morning!
On the downside, 780 was originally the target for the low of the correction. However, with time getting shorter by the reluctance of the market to come down, let’s raise it to about 825, and if that level is broken, 795-800.
Breadth
Looking below, at the McClellan Summation Index (courtesy of StockCharts), one could not ask for better evidence of strength! However, it is also overbought and in need of correcting that condition. Therefore, a short-term top here, would be perfectly logical. That’s what the shorter-term indicators of the A/D are telling us on the daily chart, and the neutral condition of the hourly chart could quickly turn to a bearish signal. An hourly close of -1300 A/D or more over the next couple of days would probably do it! But it might depend on the pattern we make on the hourly chart Monday and Tuesday. (What better time to stay tuned by starting a 4-week trial!)
Market Leaders and Sentiment
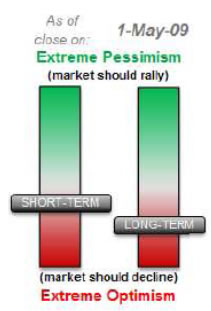
The Sentiment indicator, as you can see below (courtesy of Sentimentrader), has improved ever so slightly, but not enough to suggest that we are ready to push the advance much further. And, if the market does go up a few points more, the indicator will become even more bearish.
Both the Summation index and the NDX/SPX relative strength look great for a continuation of this uptrend, but not before there is a correction.
Summary
Here is the current most probable market profile: The SPX made an intermediate-term low at 667 on March 6th which started an intermediate counter-trend rally -- probably EW intermediate wave 4 -- and which is far from finished. But it is in need of a short-term correction of a couple of weeks.
A short-term top came on either Thursday 4/29 when the SPX reached 888, or will do so at about 900 this coming week, and should last until just after the publication of the next Newsletter due on 5/17
Andre
The following are examples of unsolicited subscriber comments:
Awesome calls on the market lately. Thank you. D M
Your daily updates have taken my trading to the next level. D
… your service has been invaluable! It's like having a good technical analyst helping me in my trading. SH
I appreciate your spot on work more than you know! M
But don't take their word for it! Find out for yourself with a FREE 4-week trial. Send an email to ajg@cybertrails.com .
By Andre Gratian
MarketTurningPoints.com
A market advisory service should be evaluated on the basis of its forecasting accuracy and cost. At $25.00 per month, this service is probably the best all-around value. Two areas of analysis that are unmatched anywhere else -- cycles (from 2.5-wk to 18-years and longer) and accurate, coordinated Point & Figure and Fibonacci projections -- are combined with other methodologies to bring you weekly reports and frequent daily updates.
“By the Law of Periodical Repetition, everything which has happened once must happen again, and again, and again -- and not capriciously, but at regular periods, and each thing in its own period, not another’s, and each obeying its own law … The same Nature which delights in periodical repetition in the sky is the Nature which orders the affairs of the earth. Let us not underrate the value of that hint.” -- Mark Twain
You may also want to visit the Market Turning Points website to familiarize yourself with my philosophy and strategy.www.marketurningpoints.com
Disclaimer - The above comments about the financial markets are based purely on what I consider to be sound technical analysis principles uncompromised by fundamental considerations. They represent my own opinion and are not meant to be construed as trading or investment advice, but are offered as an analytical point of view which might be of interest to those who follow stock market cycles and technical analysis.
Andre Gratian Archive |
© 2005-2022 http://www.MarketOracle.co.uk - The Market Oracle is a FREE Daily Financial Markets Analysis & Forecasting online publication.