


Agnostic Approach to the Stock Market Rally
Stock-Markets / US Stock Markets May 09, 2009 - 02:26 PM GMTBy: Jack_Steiman

 This weekend we discuss where we've come from and what the possible road map may look like this weekend. Just an overall review of what's taken place since the March 9th bottom and what we can likely expect in the near term. There are a few potential scenarios and I will discuss them in detail here.
We were very fortunate to hit the exact low on March 9th, took our last short off the day before, because we finally saw the one thing we had been waiting for to go long. We finally saw positive divergences on not only the daily charts but on the weekly charts as well. In addition, the monthly charts, although they had no divergences in place, were as oversold as any time in history or at least as far as my memory goes back. At 50 years old, although I often act 5 as my wife often tells me, I've been around a bit and I hadn't seen that type of oversold. When you take in the depth of oversold on the monthly's as well as the daily and weekly's and add in positive divergences on those daily and weekly charts across the board you have the combinations necessary for a strong countertrend rally.
Let's not worry about whether it's a new bull market or just a countertrend rally at this moment. The reality is it was time to go higher. That's all that mattered, and thus our last short came off and long we went. Let me also remind you all that at the lows we saw the greatest bull bear spread of pessimism ever recorded. If you couldn't go long at that moment in time you never could. Of course, you have that beast known as emotion playing on the minds of the masses, and thus having the guts to go long wasn't easy and we totally respect that. The news was horrible and you didn't hear a word of anything positive anywhere. That's rare, especially when you have financial stations that trot out nothing but perma bulls all the time. Even they had a rough time saying the word buy in that environment.
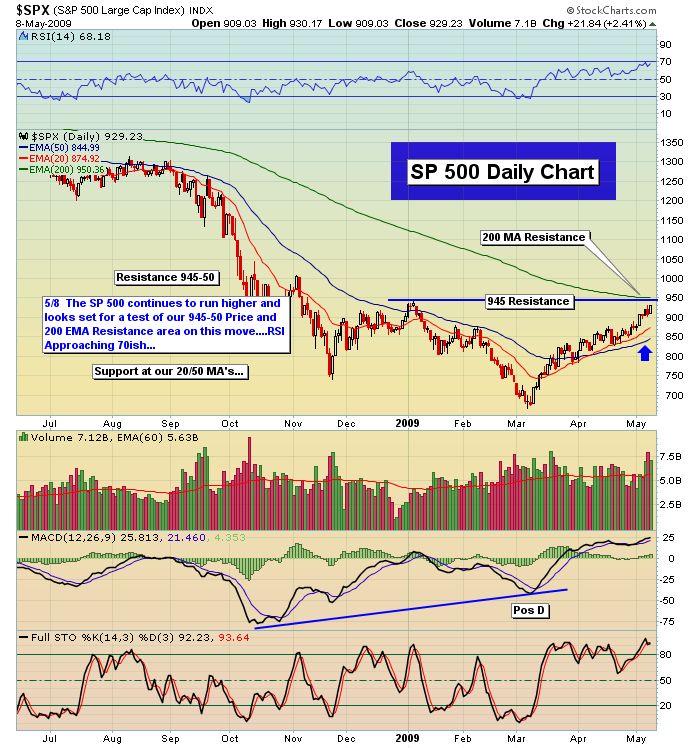
The pessimism was so thick you couldn't see across a tiny room. It hurt mentally just to be around the market. Everything was thus in place for the blast off the bottom and blast we did. We've gone higher than most thought even remotely possible. One of my nightly newsletter reports was all about that. How we would go higher than almost anyone thought and it was due to the level of pessimism out there and those charts which screamed big rally dead ahead. This is why we have caught, fortunately, the whole of this move. So here we are, from 666 to 929. So naturally the masses are saying this has been a great rally but there can't be much more. Same words all the way up. So is it possible there really could be more? We're about to find out, my friend, as we head to the neat level of absolutely massive resistance at Sp 943.85 or the January highs before this market went to you know where. We just cleared the 918 gap and now we stare at that 943.85 level and wonder what awaits this very overbought market once we get there. That's where it gets more than interesting.
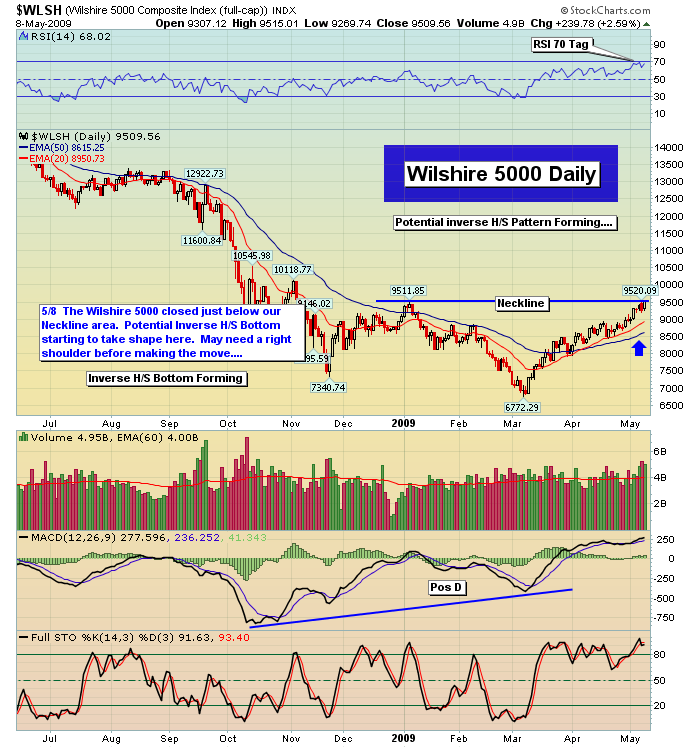
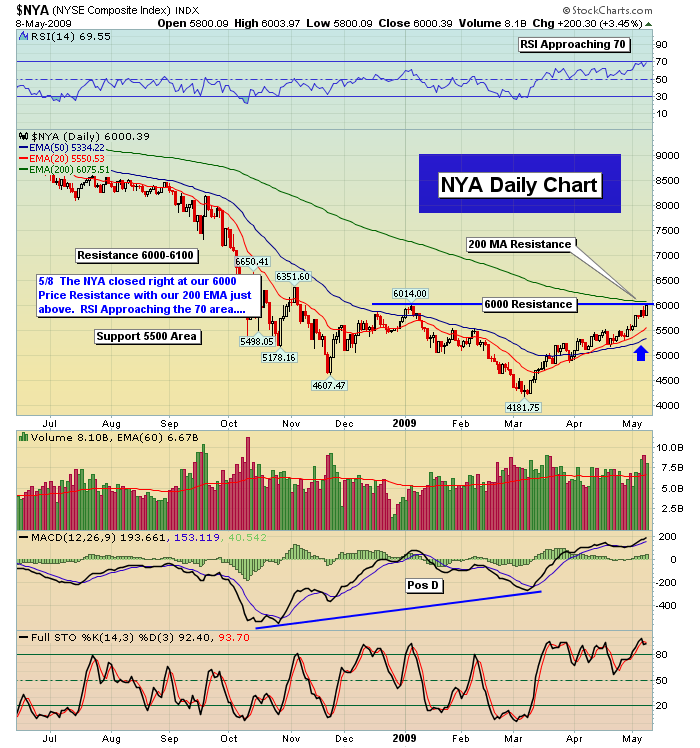
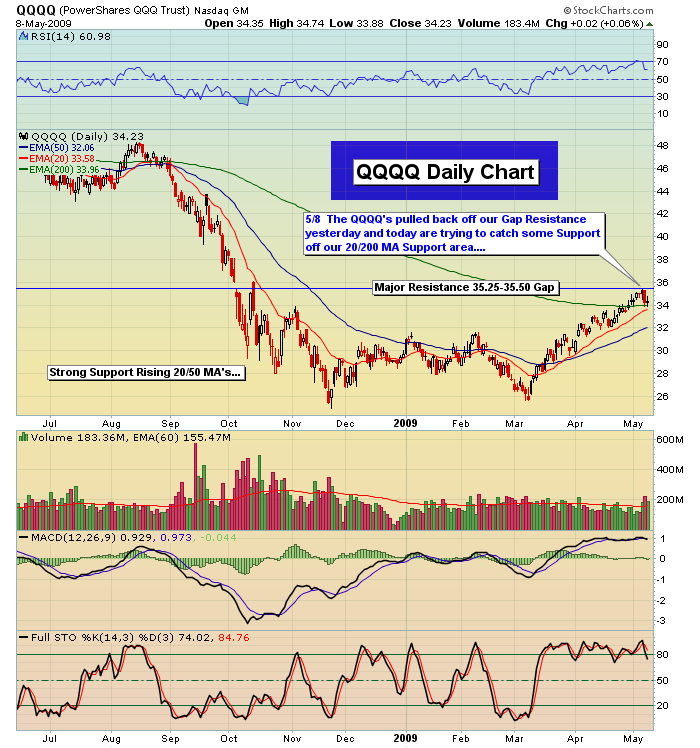
When studying the charts one by one, meaning the Sp, Dow, Nas, Ndx, Wilshire, Small caps and mid caps, one thing stands out. There are no negative divergences worth talking about. Some will argue that the flattening out of the Macd is a negative divergence but I think not. To me that would occur only when we have a strong pullback in price followed by equal or new highs that has a very weak reflexive Macd on the way back up. That would be the topping signal I'm looking for. This move has been so impulsive in price that the Macd has never had a chance to unwind and then put in that type of negative divergence. So without a true negative divergence it's hard to say things will just end.
They could. Understand that they absolutely could without any warning but that's not normally the way it happens. If it were to happen that way we'd get caught in a few long plays, such as Danaher Corp. (DHR) and Intercontinental Exchange (ICE). Nothing you can do about that as you simply play what you see. If it ends suddenly you have a couple of small losers but that's the game. You want to participate as long as the market message doesn't change. Up here at these levels, that's the reason for less exposure than the recent past. Danger zone just ahead of 943.85. At the very least, with the market being extremely overbought, you'd expect a strong pullback that would be a buy at least one last time. Again, if that final push up after some decent selling puts in negative divergences, it's time to short and say thanks and goodbye to the rally.
It's very important to remember that being overbought is NOT a sell signal unto itself. Overbought with negative divergences on the Macd and other oscillators is the true sell signal. Just because we may have a strong pullback does not mean the rally is over although it will definitely feel that way, especially after every bear on the planet screams it as such. Your emotions will be tested all over again. Buying weakness won't feel good but will be the way to go. We will need a full unwinding of these oscillators at some point and 943.85 is as good a place as any and an appropriate one as well. Following the message of the market is essential and I often hear that we're now on a sell signal just because we're very overbought.
Tell that to the bears over the last 150 Sp points. We've been very overbought for a very long time. The market, once it has cleared an important resistance level, has been making its way up to the next strong resistance level without much hesitation. Again, that next level is 943.85. Getting very aggressive in front of that level makes no good sense until we see how it resolves itself. Selling from that level would be healthiest for the markets for sure.
So what potential longer term level does this market possibly have in mind? Well, if you look at the inverse pattern on the Sp, there is the head of the inverse pattern at 666, or the March low. The neckline at 875 that we all remember fondly is 209 higher then that March low. If the full pattern were to play out you would add 209 points to 875 and we come up with 1084. I know that seems impossible. 929 seemed impossible too when we were at 666 and the world was about to go away. I am not saying that this is where we're going for if we do get negative divergences after some selling on the next move up, we will not see that at all but the pattern does suggest the possibility.
You have to respect the pattern as it is quite large and has taken many months to form. The longer and deeper the pattern, the greater the chance for success. NO guarantee on this at all for if we are still in a bear market, bull patterns tend to fail well short of their measurements. Just keep in mind that getting too bearish too soon is not wise. See the negative divergences form on those daily charts. Surely I will let you know if and when that takes place. Of course it will happen some day but we just don't know from where. It may be that 943.85 or thereabouts, of course, will be about the top of this rally and down we'll go. Let's see the evidence before making that the guarantee every bear will undoubtedly do.
Bottom line is this. Approach the market from an agnostic approach. Never be a bull and never be a bear just for the sake of it because it feels like you should be. Approach each day with an open mind. Respect the messages being sent even if you don't like it. Lose emotion. At the end of every trend you will have a few losses because you were playing correctly. You were respecting the message as you should until it changed. That's fine. With how we've done in this market we can accept that reality when it hits. Maybe we can avoid it. We'll see but your job is to never have a predetermined notion of what's coming. Know the key levels. Respect the price action. Review the internals as things move along as we have daily. You'll notice as I write about them daily they have, for the most part, kept their bullish bias all the way through and has helped us maintain our bullish ways. Never fight the market. Go one day at a time. For now we watch 943.85 with great interest to understand the future.
Peace
By Jack Steiman
Jack Steiman is author of SwingTradeOnline.com ( www.swingtradeonline.com ). Former columnist for TheStreet.com, Jack is renowned for calling major shifts in the market, including the market bottom in mid-2002 and the market top in October 2007.
Sign up for a Free 30-Day Trial to SwingTradeOnline.com!
© 2009 SwingTradeOnline.com
Mr. Steiman's commentaries and index analysis represent his own opinions and should not be relied upon for purposes of effecting securities transactions or other investing strategies, nor should they be construed as an offer or solicitation of an offer to sell or buy any security. You should not interpret Mr. Steiman's opinions as constituting investment advice. Trades mentioned on the site are hypothetical, not actual, positions.
Jack Steiman Archive |
© 2005-2022 http://www.MarketOracle.co.uk - The Market Oracle is a FREE Daily Financial Markets Analysis & Forecasting online publication.