


The Stock Market "Bull or Bear" Debate Will Be Resolved Soon
Stock-Markets / Stock Index Trading May 10, 2009 - 02:56 PM GMTBy: The_BullBear

 The transition from the Fear trade to the Inflation trade is in progress.
SUMMARY
Markets are nearing a resolution which is graphically illustrated by the relationship between the 50 and the 200 EMA. Fundamentally, the economic news flow will either continue to support the recovery thesis or we will see renewed deterioration. The author's expectation is that the fundamentals will continue to show gradual improvement and the markets will manifest this with a bullish crossover of the 50 and 200 EMA.
FUNDAMENTAL ANALYSIS
The primary economic fundamental in an economy based on a fiat debt monetary system is the flow of liquidity. Our entire economy is dependent on the continual creation of debt at every level--public, corporate and consumer. The recent crisis was a Financial Panic during which the availablity of debt liquidity was abruptly restricted. The economic recession was a by product of this sudden debt market contraction. The sudden absence of unlimited debt also revealed many long term structural deficiencies in the US economy. The most glaring example of this is the auto industry. The fundamental structural failure of the Big 3 automakers had been papered over for decades by the vast and ever increasing flow of debt in the economy. When the availability of debt to those companies and to the consumers that supported them ceased, a glimpse of the underlying economic reality was revealed.
Many argue that the Fed has blown its last bubble and that they will not be successful at reflating the economy with the historic and massive monetary and fiscal stimulus that has been and continues to be unleashed. I believe that they are right and yet wrong at the same time.
On a longer term time frame they are right. It's over for the US economy unless and until new, vital growth industries emerge to drive real, sustained economic growth. I would note that I regard this as a strongly plausible outcome and that such growth engines may emerge from radical, game changing technological innovations. No longer will a reflationary bubble will be able to mask the fundamental lack of real growth in the economy. Some asset prices may benefit by an inflationary stagnation at best and a hyperinflationary depression at worst awaits us in the future absent major new developments in the real economy.
On a shorter term basis (out to 2012), those who argue for the failure of the reflationary gambit will most likely be proven wrong. The unprecedented liquidity recently created by the Fed and the Treasury (and worldwide as well) will find its way into markets and the economy and will prevent an economic collapse and will even produce the appearance of some economic growth for a period of 18-36 months.
If such a reflationary period does not produce vital new engines of economic growth in the forms of new industries and new technologies, then the massive public sector indebtedness will essentially be non-yielding debt and the next phase of "The Collapse" will then ensue: public sector debt default, US Treasury market collapse and US dollar crisis. Such a crisis will, as with the recent Panic, be used as the justification for a further move towards financial and economic globalization including the introduction of global and regional currency regimes.
The coming period will be described by asset price inflation resulting from monetary inflation; in essence, a bubble will be produced.
MARKET ANALYSIS
The fundamental picture is reflected graphically in the charts of equities and commodities markets. A review of these markets show that a common technical theme is developing in all charts. This feature is often regarded as a key descriptor distinguishing a bull from a bear market. I am referring to the relationship between the 50 day and 200 day expontential moving averages (EMA).
When a market which has been in a bear trend surpasses its 200 EMA, many analysts consider this the hallmark of a shift to a bull trend. It certainly is a first shot across the bow at the bear. Of course, the inverse applies to a bull trend. In certain markets we have already seen this occur: QQQQ, SMH, IWM.
For me the confirmation of a change of trend is the crossover of the 50 above the 200 EMA. By this definition two key indicators, the VIX and the Japanese Yen, are now in bear markets. Those occurences have bullish implications for the general equities markets. We'll come back to this later when we have a look at Intermarket Analysis.
A survey of the charts at this time shows that across the board the 50 EMA is rising to meet the 200 EMA with price trading in between the two. This is a setup for a transition. It is more than possible for this setup to fail. But there are strong indications that this setup will produce a bullish resolution. Let's have a look at some charts:
INTERMARKET ANALYSIS
Markets outside of sphere of equities frequently foreshadow developments in the stock markets. At this time many key intermarket indicators appear to be setting up for or currently telegraphing a bullish resolution.
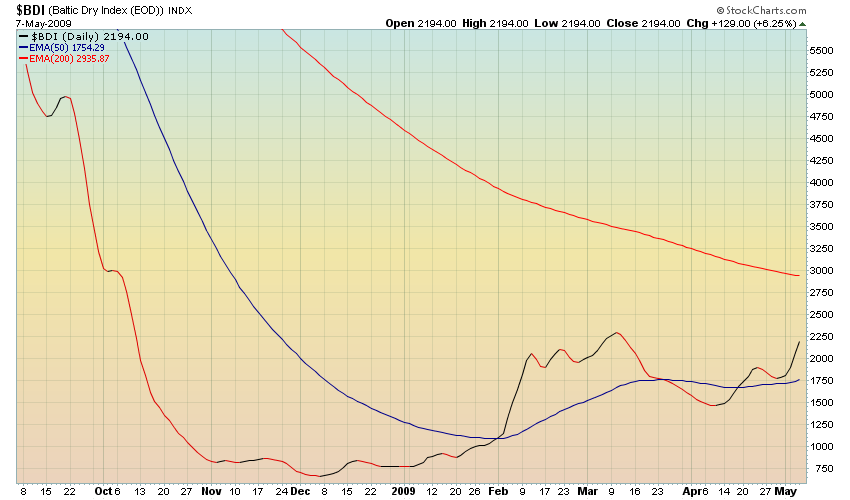
The Baltic Dry Index has been a much touted index of global economic activity and was certainly showcased as a herald of worldwide economic collapse. A recovery in the BDI would give the lie to the global depression hypothesis. The chart shows price rising between the 200 and 50 EMA with the latter upturning. Price found support in the area of the 50 EMA which is also bullish action.
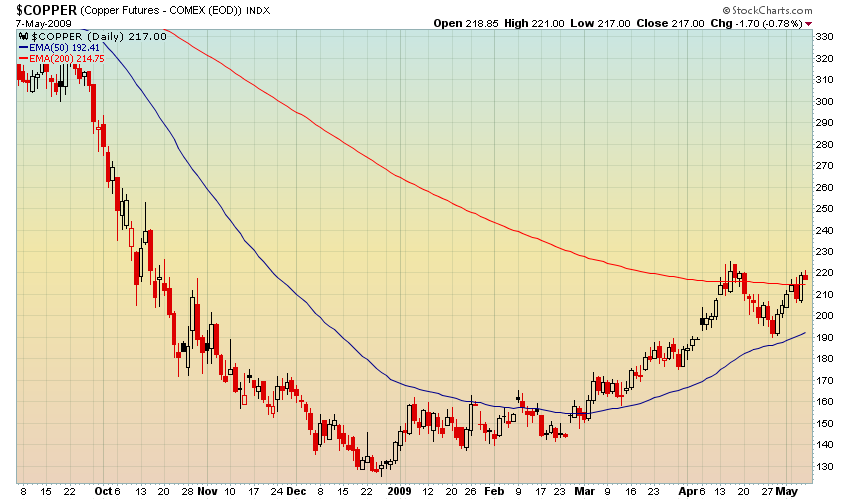
Copper is also considered a leading indicator of global economic activity. The chart shows that price has recently tested the 200 EMA, retreated to nearly the 50 EMA and has now closed above the 200 EMA on a weekly basis. This is a very bullish development and strongly contradicts the recession/depression thesis. It is also a harbinger of inflation. At this time China is taking much of its recently appreciated dollar reserves and buying up recently depreciated hard assets like copper.
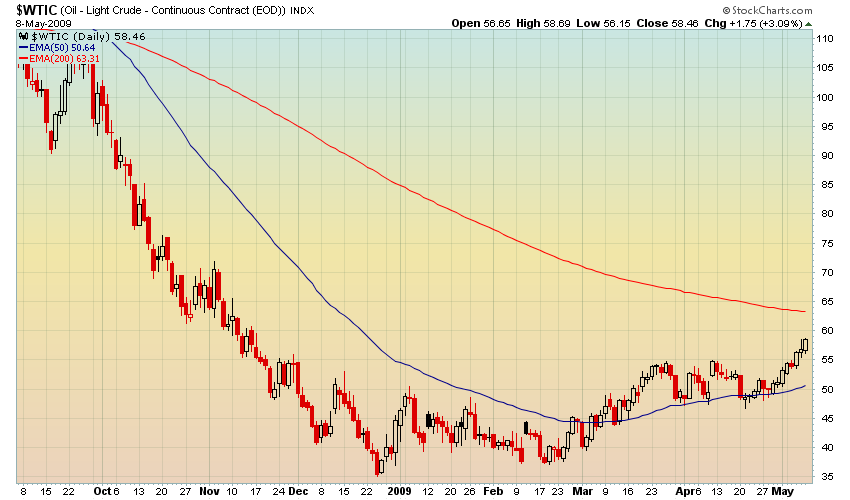
CRUDE OIL has broken above its 50 EMA and then retested it several times and has broken out strongly in the direction of the 200 EMA. The fundamental implications of this are the same as for copper.
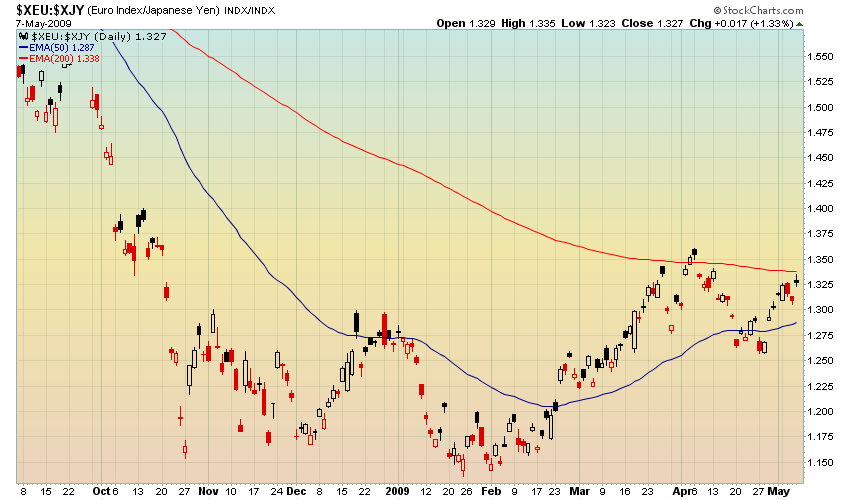
The EuroYen has long been both an indicator of risk appetite and a major direct engine of liquidity to world markets via the Yen carry trade. The willingness of market participants to take on risk by selling the Yen and investing the proceeds in higher yielding assets is a leading indicator of recovery in asset prices. This cross is now challenging its 200 EMA and has been playing between the 50 and 200 for months. This chart is a great illustration of the transitional process that unfolds in a market as it moves from bear to bull. The market is likely to jump over the 200 EMA soon followed by a bullish 50/200 EMA cross within 45 days.
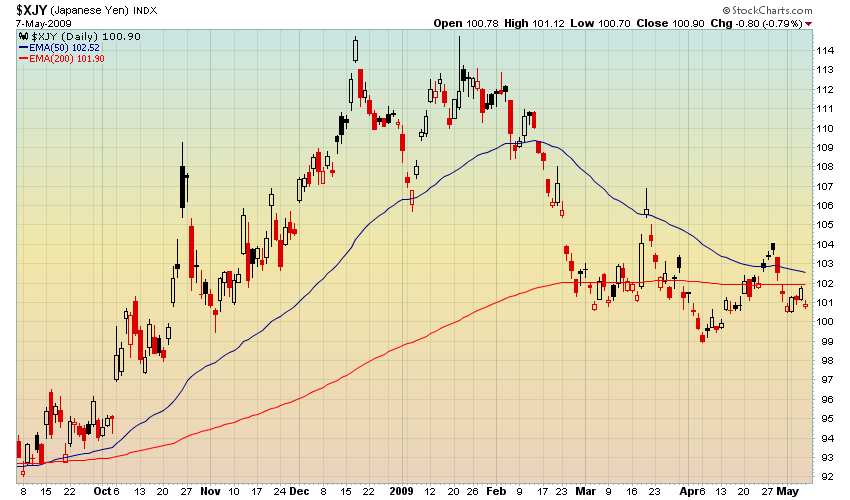
The DollarYen is now trading below both the 50 and 200 EMA with a bearish 50/200 crossover appearing to be imminent. This validates the Yen carry trade thesis mentioned above.
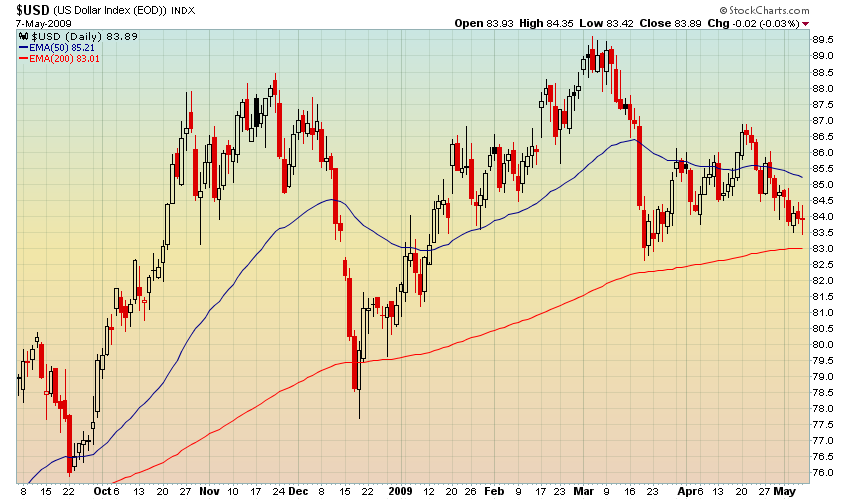
The US Dollar Index is trading between the 50 and 200 EMA. The general technical picture is bearish and a weekly close below the 200 EMA would appear to be imminent. The mini-bull market in the dollar was a direct result of the Financial Panic and a flight from risk assets to the relative safety of cash. If that worm has turned then cash will be disfavored over risk.
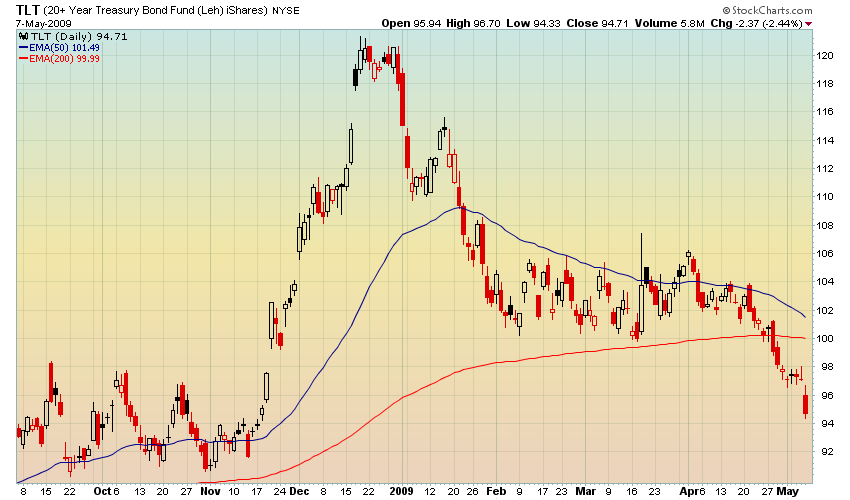
Long Term US Treasuries, which also played a flight to safety role during the Panic, has broken down decisively below its 200 EMA and a bearish 50/200 crossover is imminent. This is very bullish action for equities since the money parked in Tresuries will look for a new home in risk assets. The breakdown is all the more dramatic given the Fed's new "Quantitative Easing" policy of direct monetization of US debt.
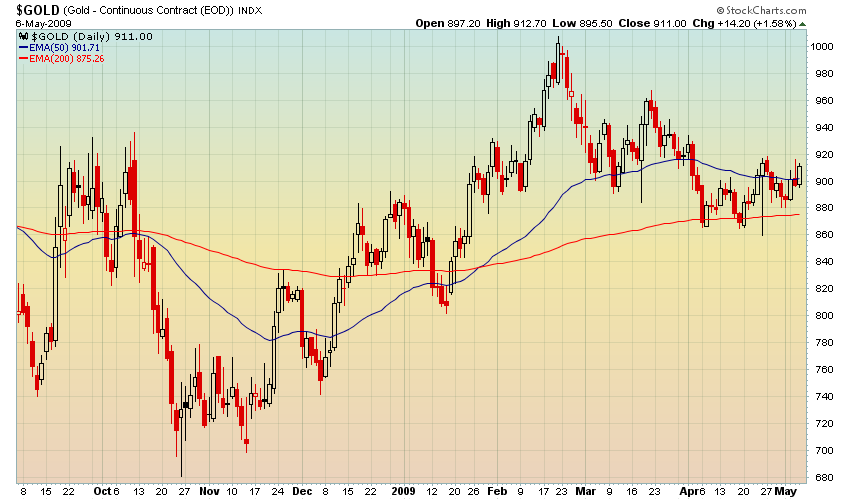
Gold is the classic inflation canary and its persistent resistance to the deleveraging trend may be good indicator of future asset price reflation. Technically, Gold had many opportunities to break down and head for its long term trendline in the 650-700 area yet it failed to do so. Once price crossed the 200 EMA and the subsequent bullish 50/200 crossover it held several times on tests of the 200 EMA and has recently broken back above the 50 EMA on a weekly basis. The chart above is a precursor to the price and MA activity of the SPX over the next 4 months as the transitional relationship between the 50 and 200 EMA plays out. The Gold chart here defines a bull market: rising price supported by the 50 EMA on a weekly basis and the 200 EMA on a longer term basis.
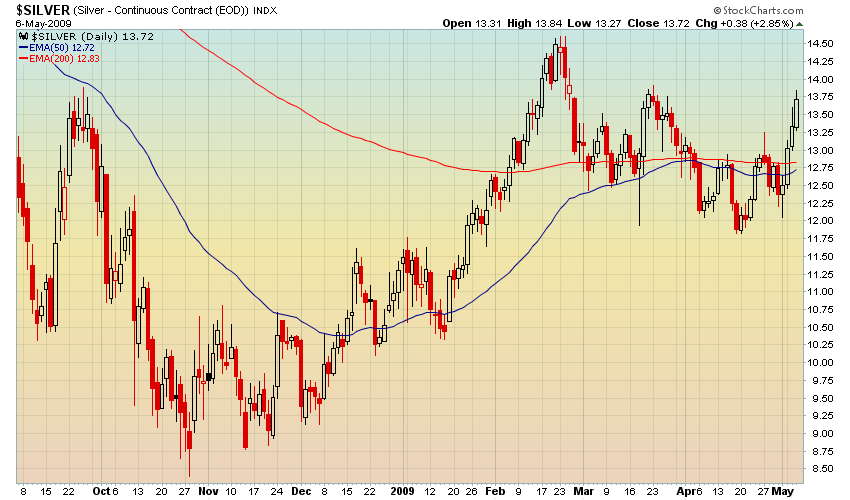
Silver this week signalled a renewed bull market and a bullish 50/200 crossover is imminent.
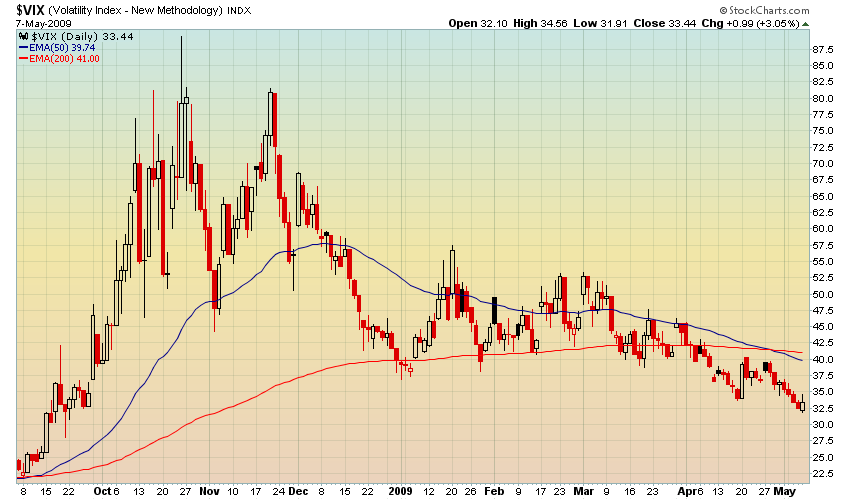
The Volatility Index (VIX) trends inversely to the equties markets and is in a clear downtrend. This week a bearish 50/200 crossover occured signalling a bull market in equities. Could this be a false signal? Sure! But it's not likely given the extensive process required to produce this technical condition. Significant breakdowns (and breakouts) almost always retest the break, so I would expect a selloff in the SPX soon which would correlate with a re-cross of the 50 over the 200 and a rise in the VIX to the 37.50-40.00 area.
EQUITIES MARKETS
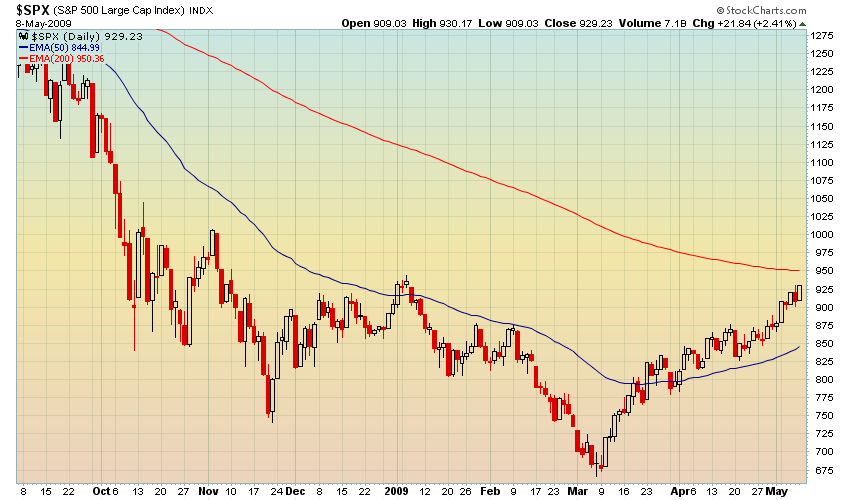
The S&P 500 index of large capitalization stocks is my preferred indicator for overall market trend and performance. We can see that price is rising between the 50 and 200 EMA with a test of the 200 appearing to be imminent. Although I would suspect a short term pullback to the 875 area is likely before the market reaches the 200 EMA, the setup is for a transitional period from bear to bull with an eventual 50/200 crossover.
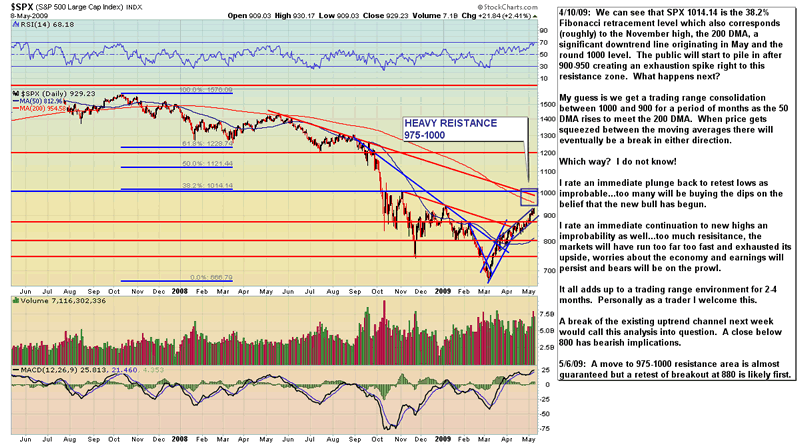
An initial impulsive move above the 200 EMA to the 1000-1015 area will be met with significant resistance. The area of the 200 EMA also correlates with a one year downtrend line, the 38.2% Fibonacci retracement level of the entire decline and the November high. This cluster of resistance will not be easily trumped. If one is inclined to short the market this would be the best zone of opportunity. My guess is that there will a 2-4 month period of price volatility between 1015 and 900 as the 50/200 EMA transitional process resolves itself with an eventual bullish 50/200 crossover. Bears will interpret the pullbacks from the resistance zone as the renewal of the bear market and bulls will be buying support in anticipation of an eventual breakout move. The fundamental news flow will likely be mixed as well, giving hope to both camps and enhancing the price volatility. If you are a trader, be prepared to range trade over the summer with an eventual break in either direction in the fall.
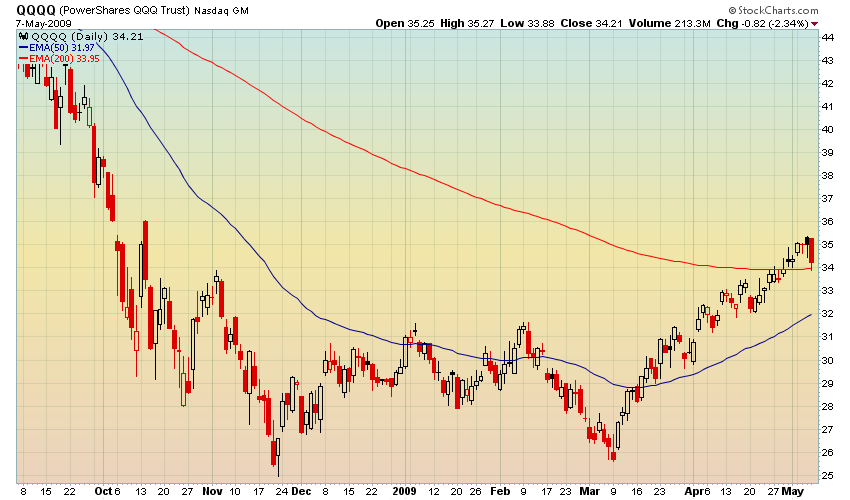
The Nasdaq 100 (QQQQ) led the move off the March bottom and has maintained a consistent uptrend since then. It has broken its 200 EMA which was then recently tested as support. It would be extemely rare for an initial cross of the 200 EMA to hold and so a trend break and violation of the 200 EMA in an overbought selloff is very likely soon. Price may revisit the 50 EMA before retaking the 200 EMA., which may be tested many times until the eventual bullish 50/200 crossover.
Semiconductors (SMH) also led the bull move and took out it s200 EMA but has since closed below it. A test of the 50 EMA is likely.
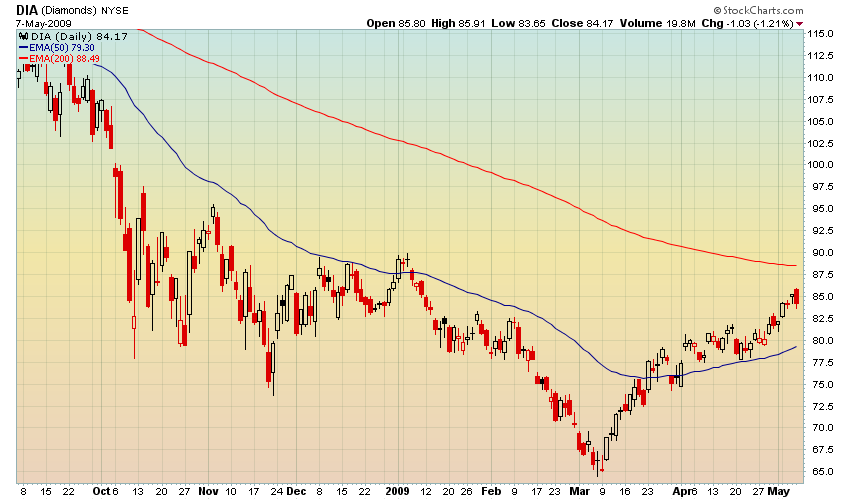
The Dow Industrials (DIA) has lagged other indices. Price is rising between the 50 and 200 EMA and the setup is similar to the SPX.
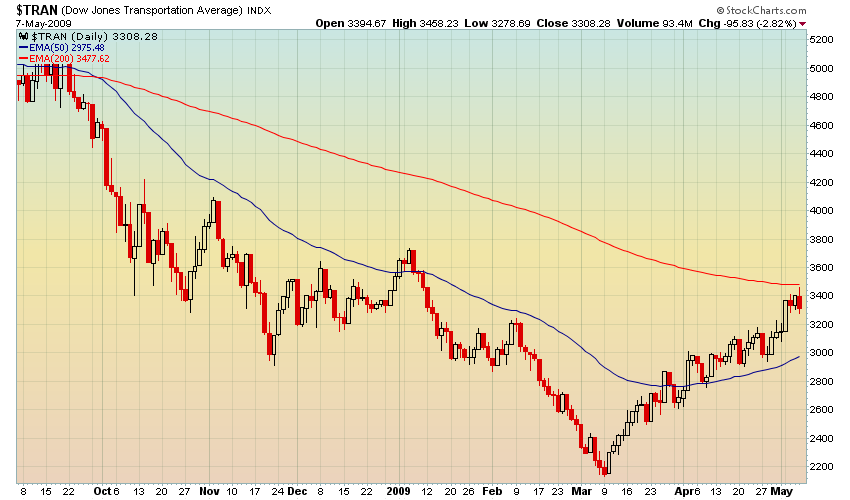
The Dow Transports (TRAN) is also set up similarly to the SPX.
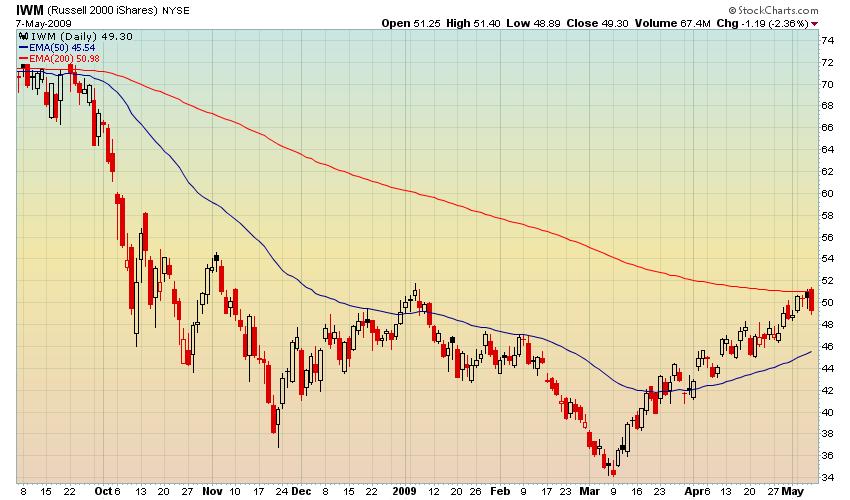
The Russell 2000 Small Cap Index (IWM) has also challenged its 200 EMA.
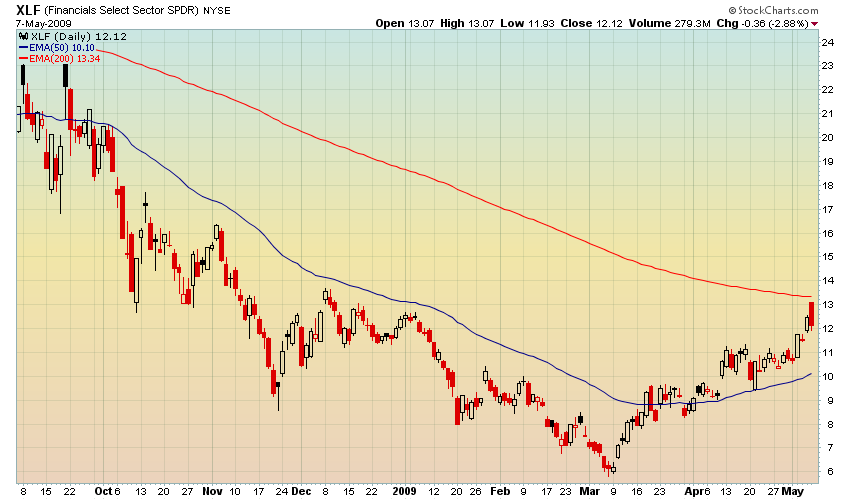
The Financial Sector (XLF) is near its 200 EMA. It may leapfrog over it for a time but again, a first time challenge is rarely successful and will meet resistance.
THE "WRONG POINT" This analysis is written with a bullish bias based on an inflationary/reflationary fundamental premise. However, the same technical indicator which would validate this hypothesis would also negate it. Just as a bullish 50/200 crossover would confirm a bull market, a bearish crossover would indicate the contrary. I call this the "Wrong Point". It's the technical and psychological moment at which I know that my market position is wrong.
I expect to be trading both sides of the market during this anticipated range bound transitional period. Basic trend following on a shorter term time basis will be used to stay on the right side of the market and will insure that I not eventually get trapped on the wrong side. Since my bias is bullish I will emphasize larger position sizes on long trades and smaller position sizes on short trades.
CONCLUSION
Having largely completed its initial impulsive short covering rally off an historically oversold bottom produced by a generational Financial Panic, the nascent Bull Market will now consolidate during a transitional period technically characterized by the interplay between price and the 50 and 200 EMA's. Investors will use this period to buy the dips to accumulate positions. Bears will attempt to reposition for an anticipated decline by selling rallies. Trapped longs will also sell rallies into technical resisitance in the SPX 975-1015 range. The overall effect will be a range trade for several months with the eventual 50/200 EMA crossover indicating the longer term trend.
DISCLOSURE: The author is currently in 100% cash with an eye towards a long re-entry at SPX 875.
By Steve Vincent
The BullBear is the social network for market traders and investors. Here you will find a wide range of tools to discuss, debate, blog, post, chat and otherwise communicate with others who share your interest in the markets.
© 2009 Copyright Steven Vincent - All Rights Reserved
Disclaimer: The above is a matter of opinion provided for general information purposes only and is not intended as investment advice. Information and analysis above are derived from sources and utilising methods believed to be reliable, but we cannot accept responsibility for any losses you may incur as a result of this analysis. Individuals should consult with their personal financial advisors.
© 2005-2022 http://www.MarketOracle.co.uk - The Market Oracle is a FREE Daily Financial Markets Analysis & Forecasting online publication.