


Quantitative Easing Pushes U.S. Treasury Bonds Into Secular Bear Market
Interest-Rates / US Bonds May 28, 2009 - 01:26 AM GMTBy: Guy_Lerner

 A monthly close over 3.432% confirms the secular trend change in the 10 year Treasury bond that I have been expecting and writing about for over 6 months. I am expecting yields pressures to persist for the next 12 months.
Figure 1 is a monthly chart of the yield on the 10 year Treasury bond. The "next big thing" indicator is in the lower panel, and it has been indicating that there is a high likelihood of a secular trend change in Treasury yields. A monthly close over the most recent pivot or resistance level provides confirmation of this secular trend change.
Figure 1. Yield 10 Year Treasury/ monthly
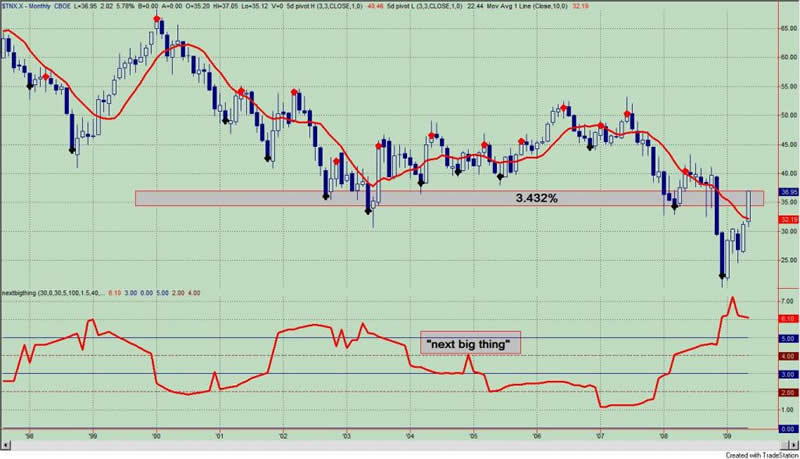
While yield pressures should persist for some time, this won't be a straight line shot to a 5% yield. In the near term, technical considerations should limit the upside to Treasury yields, and over the next couple of months government intervention and the struggling economy will likely remain headwinds.
Figure 2 is a daily chart of the ProShares UltraShort 20+ Year Treasury (symbol: TBT). This is a leveraged ETF product that trades on average 5 million shares per day. Per the ProShare website, TBT "seeks daily investment results, before fees and expenses and interest income earned on cash and financial instruments, that correspond to twice (200%) the inverse (opposite) of the daily performance of the Barclays Capital 20+ Year U.S. Treasury Index." In other words, TBT goes in the direction of yield and in the opposite direction of Treasury bonds. (While I have been focusing on the 10 year Treasury yield, the comments really have been applicable to all yields at the long end of the curve.)
Figure 2. TBT/ daily
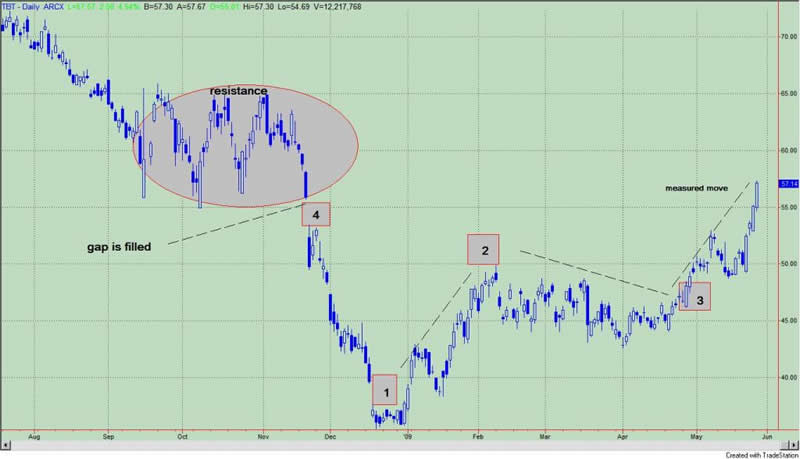
Referring to figure 2, point 1 marks the bottom for TBT; the move from point 1 to point 2 led to a healthy 3 month consolidation; the breakout was at point 3. According to the "text book" of technical analysis, the move from point 3 to today's close is a measured move in that it is equal to the point move from point 1 to point 2. In addition, TBT is filling the gap down that occurred back in November, 2008 (see point 4), and there is significant resistance in this area (see oval on the chart). Based upon this analysis, the price action has been bullish for yields, and I would look for TBT to consolidate before heading higher. In other words, yields should back off a bit.
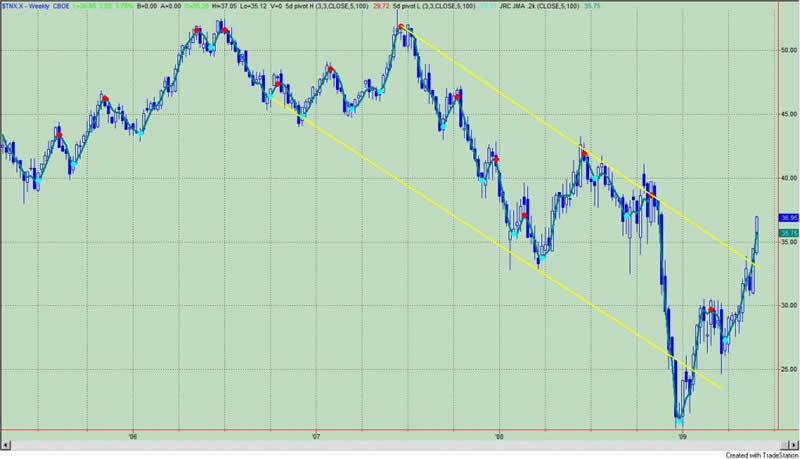
Figure 3 is a graph I have shown before and it is a weekly chart of the yield on the 10 year Treasury bond. The breakout from the down channel is evident.
Figure 3. Yield 10 Year Treasury Bond/ weekly
Lastly, higher yields in the long end of the curve must have the Federal Reserve worried. After all, wasn't quantitative easing -the Fed's "nuclear option" of monetizing debt- suppose to keep yields low so that mortgage rates would be low so that we could either refinance our personal debt and use our homes as an ATM machine circa 2005 or solve the housing crisis by somehow spurring demand. Of course, all of this was going to jump start the economy.
Somehow all of this sounds like treating the drug addicted by prescribing them more morphine. In the end, it doesn't work!
Higher yields will be a drag on the economy and on equities, and this alone will limit their ascent. Thank goodness for normal feedback loops.
But what is normal in a market manipulated by the Federal Reserve? Nonetheless, the next move will be up to the Bernanke Fed. What action, if any, will we see to reign in rates? It is obvious that the current situation is a bit out of control. Will the Fed panic? How drastic will be their interventions? More importantly, what will be the "free" market's response? No doubt the market did not like the first quantitative easing program announced on March 18. Since that day -after the initial knee jerk reaction -the yield on the 10 year Treasury bond has done nothing but move higher.
By Guy Lerner
http://thetechnicaltakedotcom.blogspot.com/
Guy M. Lerner, MD is the founder of ARL Advisers, LLC and managing partner of ARL Investment Partners, L.P. Dr. Lerner utilizes a research driven approach to determine those factors which lead to sustainable moves in the markets. He has developed many proprietary tools and trading models in his quest to outperform. Over the past four years, Lerner has shared his innovative approach with the readers of RealMoney.com and TheStreet.com as a featured columnist. He has been a regular guest on the Money Man Radio Show, DEX-TV, routinely published in the some of the most widely-read financial publications and has been a marquee speaker at financial seminars around the world.
© 2009 Copyright Guy Lerner - All Rights Reserved
Disclaimer: The above is a matter of opinion provided for general information purposes only and is not intended as investment advice. Information and analysis above are derived from sources and utilising methods believed to be reliable, but we cannot accept responsibility for any losses you may incur as a result of this analysis. Individuals should consult with their personal financial advisors.
Guy Lerner Archive |
© 2005-2022 http://www.MarketOracle.co.uk - The Market Oracle is a FREE Daily Financial Markets Analysis & Forecasting online publication.