Summer Of Stock Market Discontent as Capital Flees to Precious Metals
Stock-Markets / Gold & Silver 2009 Jun 08, 2009 - 12:40 PM GMTBy: Captain_Hook
 The following study comparing the pattern in today’s Dow to the post crash Nikki, similar to our own findings, does a good job of talking about both near term and extended possibilities within a predominantly deflationary environment that would sponsor such an outcome. Within the context of this discussion, and again, a topic we have been focusing on in attempting to identify the eventual turn back down in the broad markets, in the above Sarel Oberholster correctly points out that although the Dow has almost achieved the same percentage gain witnessed in the Nikki’s post crash bounce (31% compared to 34%), timing wise, if the patterning is to be a closer match, stocks could remain buoyant for up to another four months. You will remember we cited an extended rally as a distinct possibility within the context of a ‘seasonal inversion’ up until last week when probabilities associated with the 1929 to 1932 sequence remaining dominant shot up with a collapse in US index open interest put / call ratios.
The following is an excerpt from commentary that originally appeared at Treasure Chests for the benefit of subscribers on Tuesday, May 26th, 2009.
And sure enough, we witnessed a weekly reversal in the broad measures of stocks last week, where while it’s quite possible the markets could still hand us a surprise rally in coming months, with sentiment conditions morphing yet again, at this point the picture is suggestive such an outcome is improbable, and that risk adverse investors / speculators should be positioned for the alternative scenario. And to be sure, from the perspective the post Nikki bubble model allows for only marginal gains past recent highs set against the possibly (and now probability) of significant losses if the 1929 to 1932 pattern were to prove dominant, it makes little sense to bet against typical seasonal patterns now, with everything from stocks to crude oil blowing off into the present time frame. So it’s likely not a bad idea to both think and act in terms of the time-tested truism ‘sell in May and go away’ for equities, with the risk to the downside ever-present.
Further to this, and as pointed out by Ambrose Evans-Pritchard above, such an outcome could also cause gold to slip into a typical seasonal pattern as well, where slowing monetary aggregate growth rates would be joined by lower inflation expectations if equities were to turn down from here. What’s worse for the bulls, and in expanding on comments made by Sarel Oberholster with respect to the broad market above, if gold, like stocks, were to see volatility reduced in coming years, outside of official revaluation, it’s quite possible future growth rates for the metal of kings also slows, which is in fact the message in the monthly chart. (i.e. volatility is rolling over.) And although you may not like to entertain such thoughts, there is more evidence to this effect, which we will discuss further below. First however, let’s look at the more bullish case, where some market observers / commentators are theorizing a bond market meltdown and profound loss of confidence in the dollar ($) are just around the corner, sending the rally in precious metals into hyper-mode as the best alternative within the equity universe.
As you may know, the primary problem with such a view is that debt deleveraging would not take precedence in the initial stages of an unwinding sequence, which would be out of character when compared to previous such occurrences. One need not look back very far (think last year) for fresh reminders in this regard. Be that as it may, the bold will be bold, and they are up front and center these days in attempting to send precious metals into hyper-mode in spite of this risk profile, where the only thing that could possibly make this trade correct right now is an honest to goodness collapse in the $ based on overbought conditions across the equity complex. Is this about to happen with the likelihood of stocks rolling over high right now? Answer: No, not from a probability perspective. This perspective could certainly change with speculator betting practices in the future. And who knows, maybe this will happen if speculators begin to bet on a bearish outcome in equities running into summer. But again, for now, informed speculators should be positioning for equity weakness and $ strength beginning in earnest past this week. (i.e. with put / call ratios falling, equity weakness should become more profound the closer we get to expiry on June 19th.)
Now there are some very smart people that think the $ is in position to take it on the chin soon, with very good arguments from both fundamental and technical perspectives, however a few things must happen first before I will take such a possibility more seriously. In the first place, and limiting a discussion of technical aspects concerning a $ slide to what we already know, that being sentiment towards stocks must become bearish once again, such a development would support equity prices and allow the $ to fall, which has been the case these past months. Oh, and in checking the most recent Commitment of Traders (COT) Report I guess we need to talk about one more ‘technical aspect’ that is also sentiment related, where the current numbers show a marked increase in small speculator (dumb money) getting bearish after the big slide over the past few months. This situation will also need to reverse. Of course before this occurs stocks will need to fall more, allowing the $ to rally. Once this occurs, and sentiment shifts accordingly, then, and only then, would I be open to actually betting on a more bearish outcome for the $ moving forward, allowing ‘fundamental considerations’ to take hold.
So why would the $ fall against other fiat currencies if the economies they are attached to are in trouble too? Answer: Because the $ has been the world’s reserve currency since WWII, and although reserve profiles in countries like Russia are already moving away from $ dependency, a great deal more of this still lies ahead for most countries considering its still more than 63% of all foreign currency reserves globally. And again, under appropriate conditions, we could witness an accelerated / broad unwinding of $ reserve ratios in the not to distant future, possibly spurred by a desire to shed US debt by more and more countries. Many have bought US bonds under the wrong pretence for quite some time, thinking little to no credit risk existed. A rude awakening in this regard is undoubtedly coming at some point, and with momentum now taking hold in this direction, who knows, this could be the ‘summer of discontent’ in this regard.
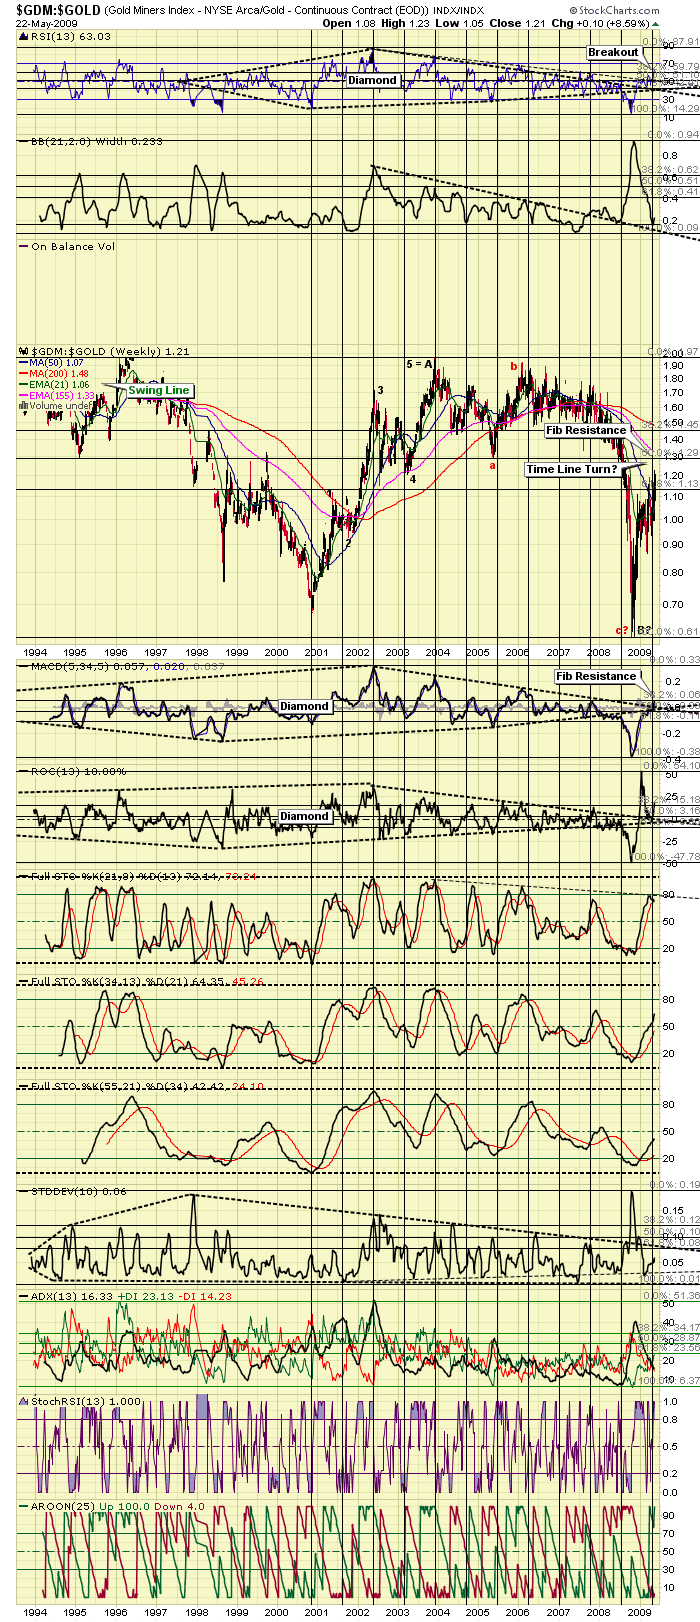
And the relative gold charts pictured below, charts that show gold stocks are leading the sector, have broken out of profound technical formations, which is what you would expect to see if this were true in the mind of a gold bug, whose numbers must be growing, no? This is the only explanation I can come up with in knowing sentiment for both precious metals and their related equities is quite optimistic at present, and yet prices are able to continue pushing higher into overbought conditions. The understanding is ‘precious metals are the best place to go when the world’s fiat currency reserve alternative becomes a hot potato’. And while it’s true the indexes themselves have not seen confirmatory indicator breakouts as well (although they have broken back into their respective growth channels), with the weekly GDM (Amex Gold Miners Index) center stage in this regard (because it’s the broadest index), it’s difficult to argue about the bullish implications of the indicator breakouts in the HUI / Gold Ratio, which again, has the shares leading the metals. Please note these are now what can be classified as multi-decade technical structures in the making, or the biggest damn diamonds, which are pressure formations, you are ever going to see anywhere. (See Figure 1)
Figure 1
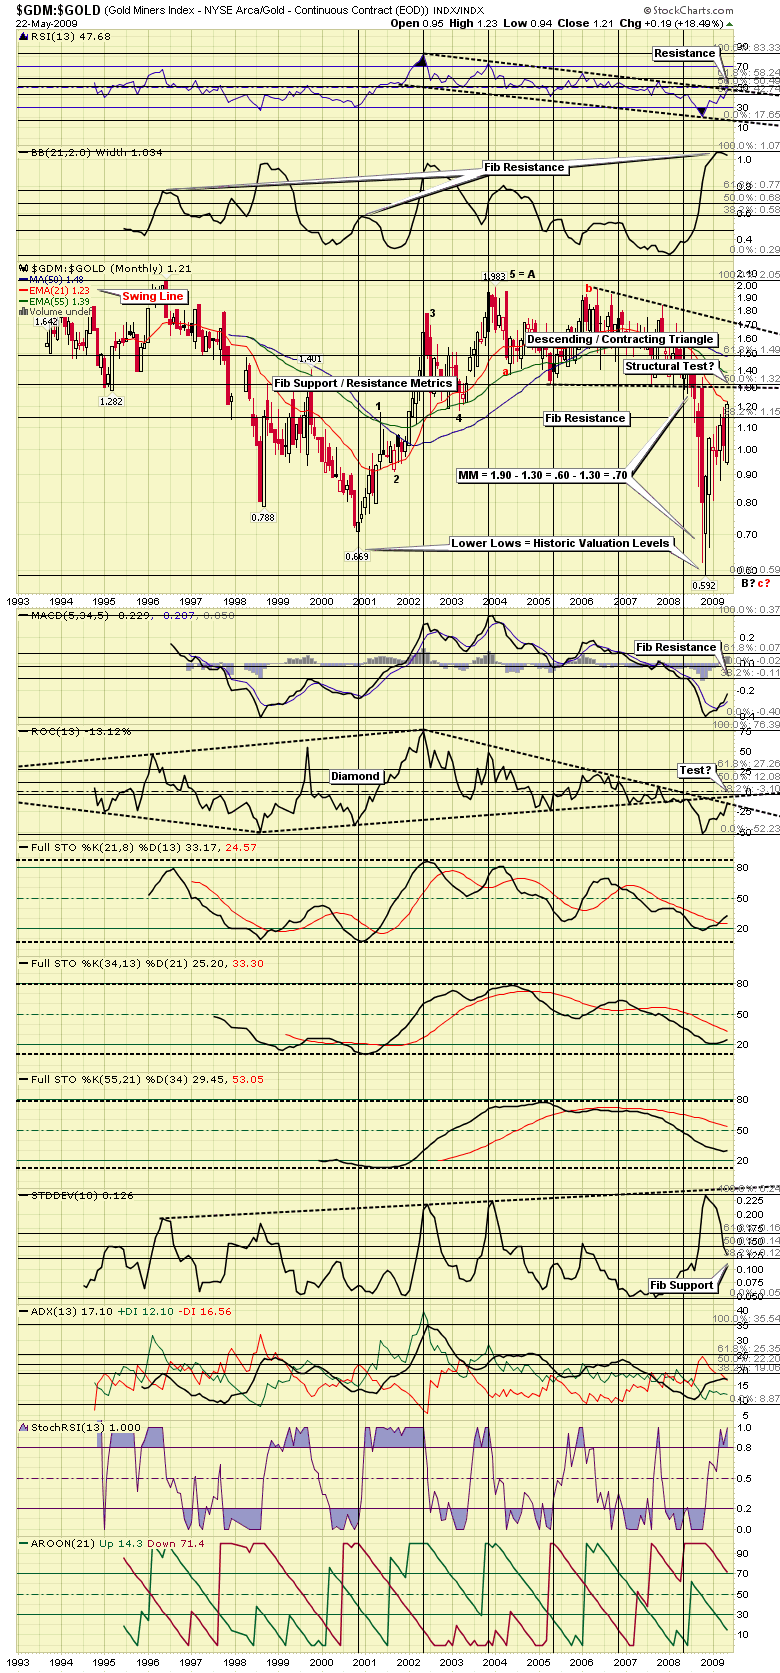
Further to this, and something you should take note of with extreme interest is the understanding that from a classic technical analysis perspective, what should happen now is the RSI breakout denoted above should fall back and test the break, and then continue higher. Moreover, this is what should happen the majority of the time, with failures the exception to the rule. What this implies is both gold and it’s related equities are now due for a pullback, but only a pullback (a relatively shallow and brief correction), to be followed by more strength. Moreover again, in my view the only way this could happen with prospects for equities so dire is if precious metals finally become the go to investment moving forward, with capital fleeing the huge bond market attempting to bottleneck into the tiny precious metals markets. Of course this is all ‘what ifs’ and ‘should be’ pontifications associated with the weeklies set against the below monthly snap shot that clearly indicates RSI still resides within a down-sloping channel here, meaning no breakout has occurred as of yet. This perspective opens the door to ‘failure’ in the weekly, or ‘volatility’ at a minimum. My thinking is while a correction of greater magnitude than the bulls are considering may unfold in coming weeks, at the same time I do think the tiny and manipulated precious metals markets will be the go to investments (I’m borrowing this catchphrase from Bill Murphy) once any deflation scare that develops in coming weeks passes. (See Figure 2)
Figure 2
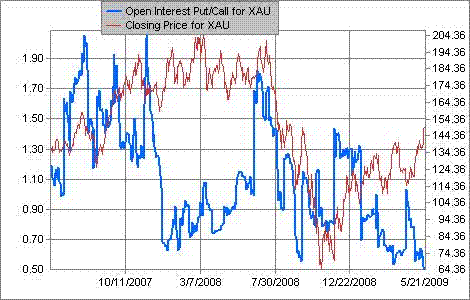
Deleveaging related weakness in the Philadelphia Gold and Silver Index (XAU) over the next couple of weeks would also work to hold things back as well, where when combined with a very optimistic investing population (put / call ratios have never been lower – see below), should see prices continue to soften into June, at a minimum. (i.e. at least until June options expire.) As you can see below, quite a divergence now exits sentiment wise set against price, which schools caution. (See Figure 3)
Figure 3
Source: Schaeffer Research
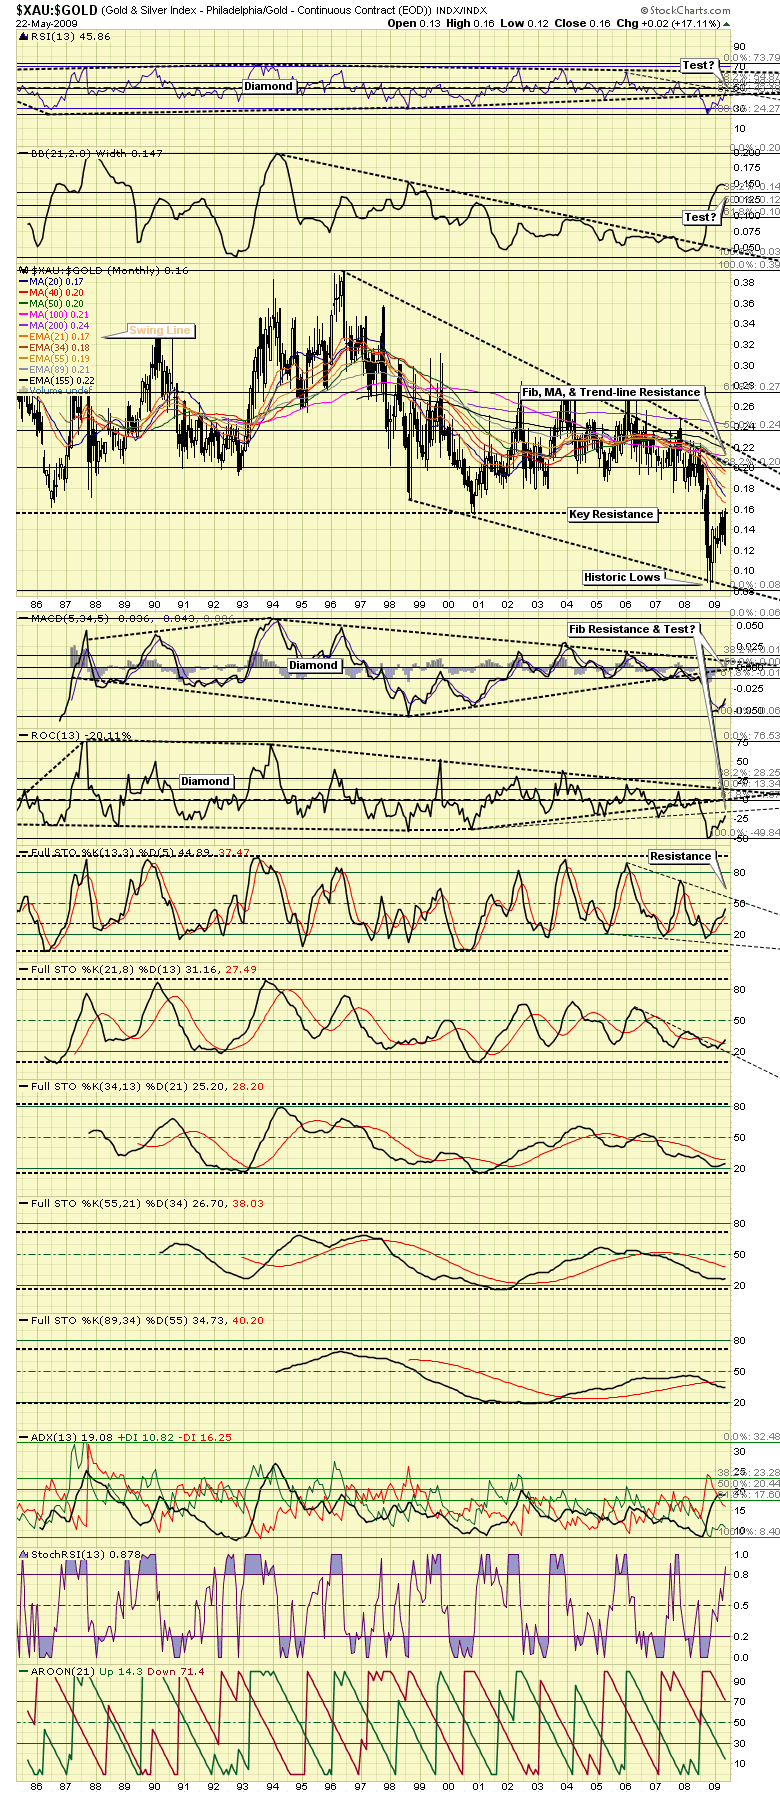
Of course most people who bother to look at such things at all are seeing indicator breakouts in charts like the monthly XAU / Gold Ratio and are getting very excited, and they should be. Unfortunately however, if history is a good guide such optimism could prove expensive prior to all the fools who bought bullish option speculations, and margin players, are parted from their money in coming weeks. (See Figure 4)
Figure 4
Unfortunately we cannot carry on past this point, as the remainder of this analysis is reserved for our subscribers. Of course if the above is the kind of analysis you are looking for this is easily remedied by visiting our continually improved web site to discover more about how our service can help you in not only this regard, but also in achieving your financial goals. For your information, our newly reconstructed site includes such improvements as automated subscriptions, improvements to trend identifying / professionally annotated charts, to the more detailed quote pages exclusively designed for independent investors who like to stay on top of things. Here, in addition to improving our advisory service, our aim is to also provide a resource center, one where you have access to well presented 'key' information concerning the markets we cover.
And if you have any questions, comments, or criticisms regarding the above, please feel free to drop us a line . We very much enjoy hearing from you on these matters.
Good investing all.
By Captain Hook
http://www.treasurechestsinfo.com/
Treasure Chests is a market timing service specializing in value-based position trading in the precious metals and equity markets with an orientation geared to identifying intermediate-term swing trading opportunities. Specific opportunities are identified utilizing a combination of fundamental, technical, and inter-market analysis. This style of investing has proven very successful for wealthy and sophisticated investors, as it reduces risk and enhances returns when the methodology is applied effectively. Those interested in discovering more about how the strategies described above can enhance your wealth should visit our web site at Treasure Chests
Disclaimer: The above is a matter of opinion and is not intended as investment advice. Information and analysis above are derived from sources and utilizing methods believed reliable, but we cannot accept responsibility for any trading losses you may incur as a result of this analysis. Comments within the text should not be construed as specific recommendations to buy or sell securities. Individuals should consult with their broker and personal financial advisors before engaging in any trading activities, as we are not registered brokers or advisors. Certain statements included herein may constitute "forward-looking statements" with the meaning of certain securities legislative measures. Such forward-looking statements involve known and unknown risks, uncertainties and other factors that may cause the actual results, performance or achievements of the above mentioned companies, and / or industry results, to be materially different from any future results, performance or achievements expressed or implied by such forward-looking statements. Do your own due diligence.
Copyright © 2009 treasurechests.info Inc. All rights reserved.
Unless otherwise indicated, all materials on these pages are copyrighted by treasurechests.info Inc. No part of these pages, either text or image may be used for any purpose other than personal use. Therefore, reproduction, modification, storage in a retrieval system or retransmission, in any form or by any means, electronic, mechanical or otherwise, for reasons other than personal use, is strictly prohibited without prior written permission.
Captain Hook Archive |
© 2005-2022 http://www.MarketOracle.co.uk - The Market Oracle is a FREE Daily Financial Markets Analysis & Forecasting online publication.


