


Stock Market Summer Seasonal Correction About to Kick Into Gear
Stock-Markets / US Stock Markets Jun 14, 2009 - 12:32 PM GMTBy: Mike_Burk

 The good news is: The blue chip indices hit multi month highs last week.
Short Term
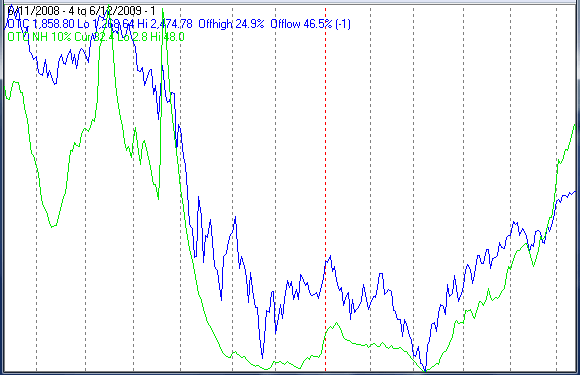
The chart below covers the past year showing the NASDAQ composite (OTC) in blue and a 10% trend (19 day EMA) of NASDAQ new highs in green. Dashed vertical lines have been drawn on the 1st trading day of each month. While the index more or less stalled last week, the indicator continued moving sharply upward suggesting underlying strength. The caveat with this indicator is the incoming numbers are very small, but, as shown by the indicator, improving.
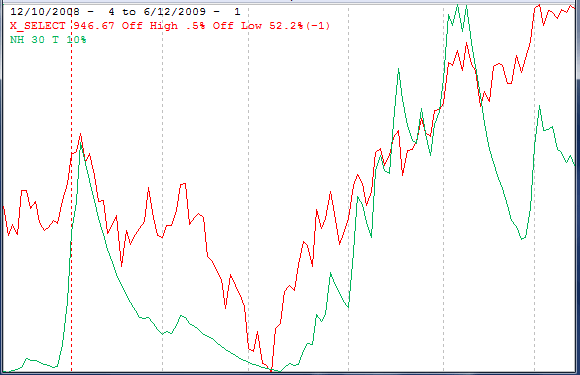
The next chart shows a different take on new highs.
The chart covers the past 6 months showing an average of the Fidelity Select mutual funds (X_SELECT) in red and the indicator is a 10% trend of new highs of the component issues of X_SELECT. In this case new highs have been calculated over the past 6 weeks rather than the past 52 weeks as reported by the exchanges. This indicator peaked in early May and noticeably deteriorated last week.
Intermediate term
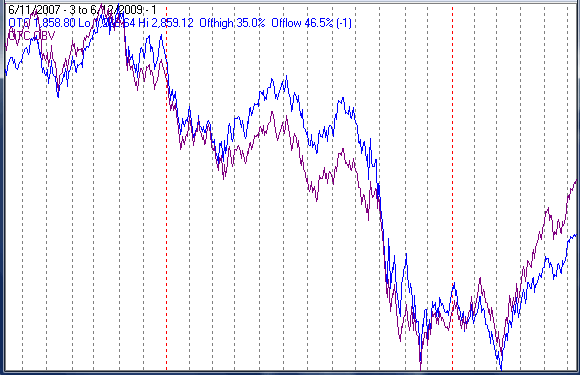
The next chart covers the past two years showing the OTC in blue and OTC OBV in purple. OTC On Balance Volume (OBV) is a running total of the daily volume of issues moving down subtracted from the volume of issues moving up.
The next chart is similar to the one above except is covers 5 years from late May 2000 to early June 2005. Dashed vertical lines have been drawn on the 1st trading day of each year. The indicator was strong in late 2001 suggesting the market was strengthening before the final decline into late 2002.
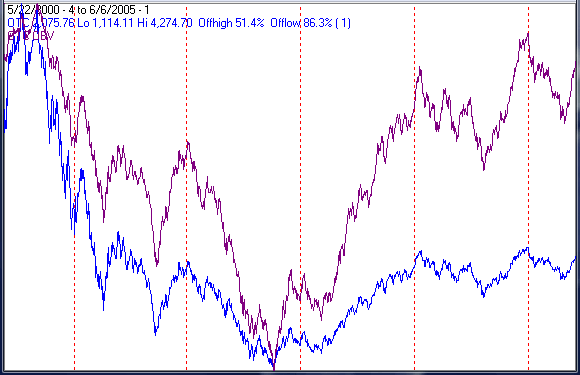
The high number of new lows at the early March low suggests there will be retest of the March lows while strengthening OTC OBV suggests that would be the final low of this bear market.
Seasonality
Next week includes the week prior to the 3rd Friday of June during the 1st year of the Presidential Cycle.
The tables show the daily return on a percentage basis for the week prior to the 3rd Friday of June during the 1st year of the Presidential Cycle. OTC data covers the period from 1963 - 2008 and SPX data from 1953 - 2008. Prior to 1953 the market traded 6 days a week so that data has been ignored. There are summaries for both the 1st year of the Presidential Cycle and all years combined.
The SPX has been modestly positive during the 1st year of the Presidential Cycle. Returns have been modestly negative by all other measures.
Report for the week before the 3rd Friday of June
The number following the year is the position in the presidential cycle.
Daily returns from Monday through 3rd Friday.
| OTC Presidential Year 1 | ||||||
| Year | Mon | Tue | Wed | Thur | Fri | Totals |
| 1965-1 | 0.38% | -1.96% | 1.05% | 0.72% | 0.65% | 0.85% |
| 1969-1 | -0.11% | -0.65% | -0.86% | -0.70% | -0.60% | -2.91% |
| 1973-1 | -0.66% | 1.70% | -0.44% | -0.74% | -1.26% | -1.39% |
| 1977-1 | 0.22% | 0.43% | -0.03% | 0.56% | 0.40% | 1.58% |
| 1981-1 | 0.09% | -1.07% | 0.01% | -0.86% | 0.39% | -1.44% |
| 1985-1 | -0.20% | 0.19% | 0.08% | -0.27% | 0.47% | 0.27% |
| Avg | -0.13% | 0.12% | -0.25% | -0.40% | -0.12% | -0.78% |
| 1989-1 | -0.06% | -0.59% | -0.02% | -0.79% | 0.02% | -1.42% |
| 1993-1 | 0.46% | 0.13% | -0.16% | -0.04% | -0.91% | -0.52% |
| 1997-1 | 0.63% | 0.78% | -0.74% | 1.03% | 0.00% | 1.69% |
| 2001-1 | -2.00% | -0.04% | -2.23% | -3.66% | -0.77% | -8.69% |
| 2005-1 | 0.29% | 0.00% | 0.28% | 0.69% | 0.05% | 1.31% |
| Avg | -0.13% | 0.06% | -0.57% | -0.56% | -0.40% | -1.53% |
| OTC summary for Presidential Year 1 1965 - 2005 | ||||||
| Avg | -0.09% | -0.10% | -0.28% | -0.37% | -0.16% | -0.97% |
| Win% | 55% | 55% | 36% | 36% | 60% | 45% |
| OTC summary for all years 1963 - 2008 | ||||||
| Avg | -0.13% | 0.02% | 0.07% | -0.03% | -0.03% | -0.10% |
| Win% | 43% | 57% | 64% | 47% | 58% | 52% |
| SPX Presidential Year 1 | ||||||
| Year | Mon | Tue | Wed | Thur | Fri | Totals |
| 1953-1 | -0.84% | -0.30% | 1.27% | -0.04% | 0.00% | 0.10% |
| 1957-1 | 0.19% | -0.41% | -0.67% | -0.61% | -0.59% | -2.09% |
| 1961-1 | -0.77% | -0.53% | 0.27% | -0.44% | -0.78% | -2.24% |
| 1965-1 | -1.30% | 0.57% | 0.84% | 0.63% | -0.47% | 0.27% |
| 1969-1 | -0.33% | -0.38% | -0.14% | -0.58% | -0.59% | -2.02% |
| 1973-1 | -0.31% | 1.49% | -0.64% | -1.12% | -1.22% | -1.79% |
| 1977-1 | 0.28% | 1.13% | -0.25% | 0.24% | 0.12% | 1.53% |
| 1981-1 | 0.09% | -1.09% | 0.89% | -1.26% | 0.48% | -0.90% |
| 1985-1 | -0.30% | 0.43% | -0.38% | 0.05% | 1.54% | 1.35% |
| Avg | -0.11% | 0.32% | -0.10% | -0.53% | 0.07% | -0.37% |
| 1989-1 | -0.14% | -0.71% | -0.02% | -1.16% | 0.40% | -1.64% |
| 1993-1 | 0.10% | -0.32% | 0.26% | 0.25% | -1.08% | -0.80% |
| 1997-1 | 0.07% | 0.06% | -0.59% | 1.00% | 0.08% | 0.61% |
| 2001-1 | -0.84% | 0.12% | -1.13% | -1.75% | -0.45% | -4.06% |
| 2005-1 | 0.23% | 0.26% | 0.22% | 0.36% | 0.50% | 1.56% |
| Avg | -0.12% | -0.12% | -0.25% | -0.26% | -0.11% | -0.86% |
| SPX summary for Presidential Year 1 1953 - 2005 | ||||||
| Avg | -0.28% | 0.02% | -0.01% | -0.32% | -0.16% | -0.72% |
| Win% | 43% | 50% | 43% | 43% | 46% | 43% |
| SPX summary for all years 1953 - 2008 | ||||||
| Avg | -0.02% | 0.08% | 0.05% | -0.18% | -0.04% | -0.10% |
| Win% | 59% | 54% | 51% | 43% | 56% | 52% |
Conclusion
The market got very dull last week. OTC NH continued to move upward (good) while the secondaries were a little weaker than the blue chips (not good).
I expect the major indices to be lower on Friday June 19 than they were on Friday June 12.
Last the blue chip indices were up slightly while the secondaries were down slightly so I am calling last weeks negative forecast a tie.
Thank you,
By Mike Burk
To subscribe to this report : http://alphaim.net/signup.html
Gordon Harms produces a Power Point for our local timing group. You can get a copy of that at: http://www.stockmarket-ta.com/ .
Disclaimer: Mike Burk is an employee and principal of Alpha Investment Management (Alpha) a registered investment advisor. Charts and figures presented herein are believed to be reliable but we cannot attest to their accuracy. Recent (last 10-15 yrs.) data has been supplied by CSI (csidata.com), FastTrack (fasttrack.net), Quotes Plus (qp2.com) and the Wall Street Journal (wsj.com). Historical data is from Barron's and ISI price books. The views expressed are provided for information purposes only and should not be construed in any way as investment advice. Furthermore, the opinions expressed may change without notice.
Mike Burk Archive |
© 2005-2022 http://www.MarketOracle.co.uk - The Market Oracle is a FREE Daily Financial Markets Analysis & Forecasting online publication.