


The Secular Trend Change in U.S. Treasury Bonds
Interest-Rates / US Bonds Jun 15, 2009 - 11:36 AM GMTBy: Guy_Lerner

 I am on record stating that yields on the 10 year Treasury bond will move higher over the next 12 months, and this will represent a secular trend change.
Figure 1 is a monthly chart of the yield on the 10 year Treasury bond (symbol: $TNX.X), and a monthly close above the prior pivot low at 3.432% yield provided the technical confirmation that yields are likely undergoing a secular trend change. In other words, the very long term trend has changed from down to up.
Figure 1. $TNX.X/ monthly
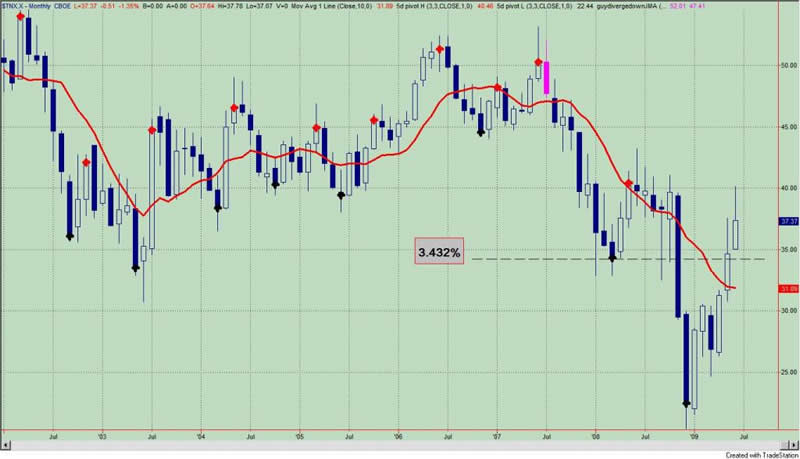
Of course, nothing grows to the sky especially if it is not in the government's best interest, so the pullback has occurred right on schedule.
So how do I know if this pullback will be "the pause that refreshes" or the start of a new down trend that will push yields back to the lows seen in December, 2008? The short answer is: I don't know, but let me put forth some clues or as I like to call them, technical sign posts that will guide our way.
First, a monthly close below our new support level of a yield of 3.432% would suggest that we will not be seeing higher yields over time, and this would basically kill my thesis that yields are undergoing a secular trend change.
Now let's look at a weekly chart of the yield on the 10 year Treasury bond. See figure 2. The pink markers over the price bars - if you squint at the graph long enough you will see them - represent negative divergence bars between a momentum oscillator that measures price and price itself. Negative divergences typically indicate slowing upside momentum with the highs and lows of the negative divergence bar acting as levels of resistance and support respectively. In other words, look for yields to remain within the range of the highs and lows of the negative divergence bar.
Figure 2. $TNX.X/ weekly (1985 to present)
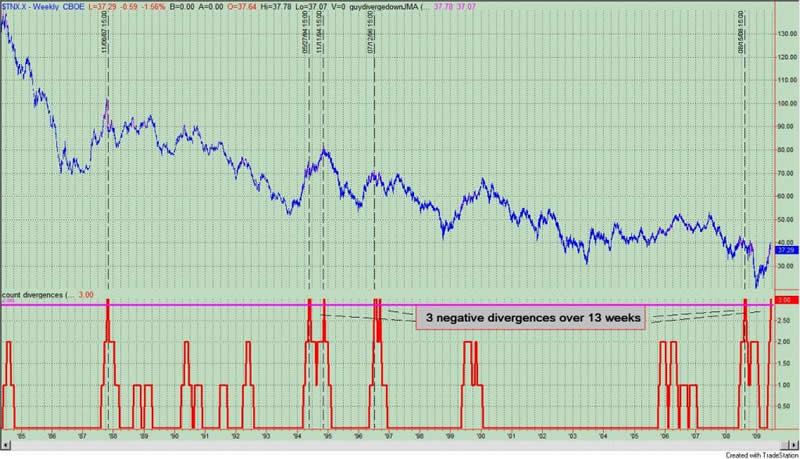
The indicator in the lower panel of figure 2 actually counts the number of negative divergence bars occurring over a 13 week look back period. What we see from the indicator is that there have been 3 negative divergence bars over the past 13 weeks, and this is noted when the indicator moves above the pink horizontal line. As we can see from the chart which goes back to 1985, 3 negative divergence bars over a 13 week period for the most part marked a high in yields that led to new secular lows. This is the strength of a 25 year bull market in bonds.
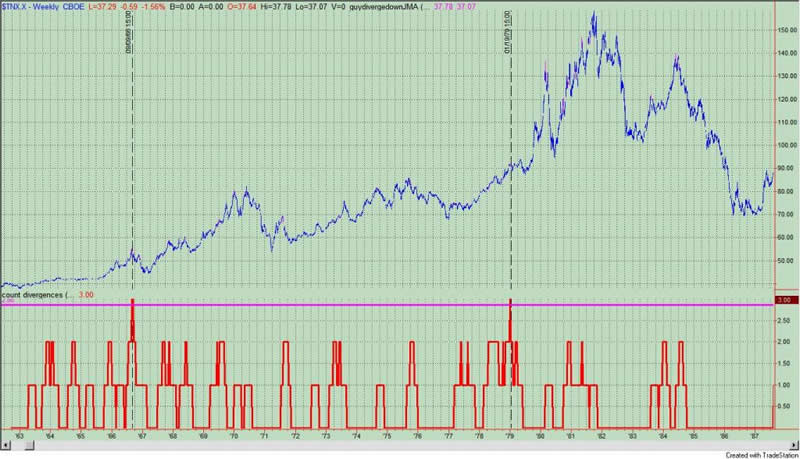
Now look at figure 3, a weekly chart of the yield on the 10 year Treasury bond capturing the period from 1962 to 1987; the two occurrences of multiple negative divergence bars actually led to a period of consolidation in yields and led to much higher yields once yields broke above the negative divergence bars. This is the strength of a 20 year bear market in bonds.
Figure 3. $TNX.X/ weekly (1962 to 1987)
So what is our conclusion? If this is going to be a secular bear market for bonds (i.e., higher yields), then two things need to happen: 1) the current multiple negative divergences will lead to a period of consolidation; 2) yields must remain above support at 3.432% on a monthly closing basis.
By Guy Lerner
http://thetechnicaltakedotcom.blogspot.com/
Guy M. Lerner, MD is the founder of ARL Advisers, LLC and managing partner of ARL Investment Partners, L.P. Dr. Lerner utilizes a research driven approach to determine those factors which lead to sustainable moves in the markets. He has developed many proprietary tools and trading models in his quest to outperform. Over the past four years, Lerner has shared his innovative approach with the readers of RealMoney.com and TheStreet.com as a featured columnist. He has been a regular guest on the Money Man Radio Show, DEX-TV, routinely published in the some of the most widely-read financial publications and has been a marquee speaker at financial seminars around the world.
© 2009 Copyright Guy Lerner - All Rights Reserved
Disclaimer: The above is a matter of opinion provided for general information purposes only and is not intended as investment advice. Information and analysis above are derived from sources and utilising methods believed to be reliable, but we cannot accept responsibility for any losses you may incur as a result of this analysis. Individuals should consult with their personal financial advisors.
Guy Lerner Archive |
© 2005-2022 http://www.MarketOracle.co.uk - The Market Oracle is a FREE Daily Financial Markets Analysis & Forecasting online publication.