


Have Stock Markets Run Away from Reality?
Stock-Markets / Stocks Bear Market Jun 16, 2009 - 05:05 AM GMT

 The predictions of the members of the Barron’s mid-year Roundtable discussion over the weekend were in agreement that the March lows of the stock markets would not be broken. This reminded me of one of the famous “Investment Rules” of Bob Farrell, legendary former chief stock market analyst at Merrill Lynch. Rule # 9 stated: “When all the experts and forecasts agree, something else is going to happen.”
Meanwhile, many stock markets yesterday registered their worst single-session percentage losses in a month. Commodities also faced heavy profit-taking, but government bonds rallied and the US dollar strengthened against a basket of currencies. “We could be seeing one of those occasional all-change signals in short-term trends,” said David Fuller (Fullermoney).
Richard Russell, veteran writer of the daily Dow Theory Letters, commented on Monday: “I’m of the opinion that this bear market rally is in the process of topping out. When a counter-trend rally tops out within an ongoing primary bear market, the odds are that the stock market will break to new lows during the period ahead. That means that the stock market will break below its March 9 lows in coming weeks. A violation of the March 9 lows would be a shocker to most investors, and it would be a forecast of an even worse economy coming up.”
As mentioned on Sunday, the S&P 500 had recently been mapping out a trading range between 925 and 950, as shown in the chart below. Yesterday’s close of 924 took the Index below the bottom of the range. As stock markets have started to show exhaustion (also seen from the low volume characterizing the last few days’ increases), the odds are that this could be more than a “false alarm”.
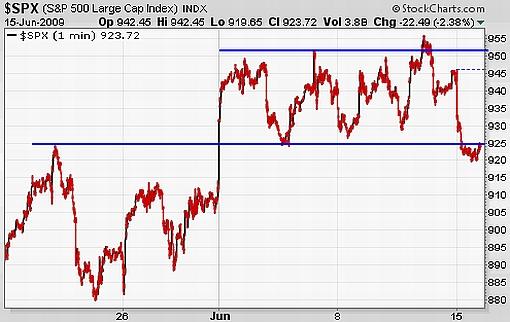
Source: StockCharts.com
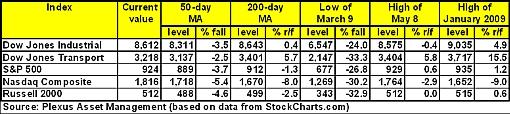
An analysis of the moving averages of the major US indices shows all the indices still trading above their respective 50-day moving averages, but the Dow Jones Industrial Index has again fallen below the key 200-day line, rejoining the Dow Jones Transport Index. With the exception of the Nasdaq Composite Index, all the indices are below the early January peaks. Importantly, the levels from where the rally commenced on March 9 should hold in order for base formations to remain in force.
Click here or on the table below for a larger image
Based on pronouncements at last weekend’s meeting of the Group of Eight finance ministers, “green shoots” seem to be wilting somewhat, leaving investors questioning whether the recent reflation trade has not been getting ahead of itself.
The “less-bad-than-expected” school of thought is largely based on survey data such as the Purchasing Managers Indices (PMIs). It therefore makes for interesting reading to revisit the historical relationship between the PMI and stock market movements. The example below shows the US composite (services and manufacturing) PMI plotted together with the 12-month percentage change in the S&P 500.
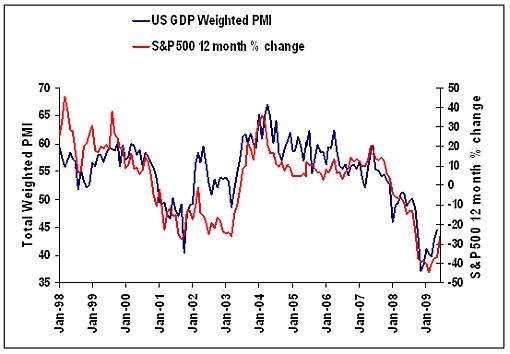
Source: Plexus Asset Management and I-Net Bridge
For some fun with numbers, I have done a regression analysis of the two series, resulting in an R2 coefficient of 0.76.
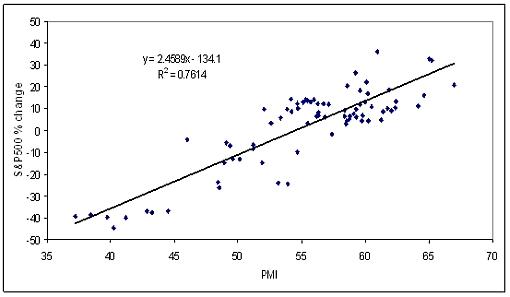
Source: Plexus Asset Management and I-Net Bridge
Applying the regression results to a range of PMI assumptions, the expected changes in the S&P 500 are as shown in the table below.
Click here or on the table below for a larger image
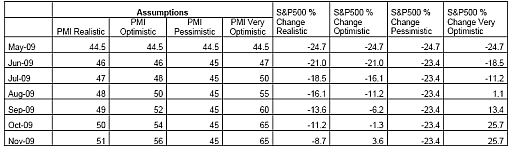
The figures show that a “pessimistic” scenario of a stagnant PMI would result in a decline of 23.4% in the S&P 500 (i.e. an index level of approximately 700). Even a “realistic” scenario of gradually increasing the PMI by 1% per month between now and November would still result in the S&P 500 being 8.7% lower by the end of November. Interestingly, the stock market seems overpriced under all scenarios over the next few months and only reaches positive territory again in August under the “very optimistic” scenario and in November under the “optimistic” scenario”.
And lastly, John Murphy (StockCharts.com) concurs, remarking: “As good as the spring rally has been, I believe the market is still in need of some corrective action (or consolidation) before moving substantially higher. V bottoms are extremely rare. W bottoms are a lot more common. So are head and shoulder bottoms. It seems unlikely that the market will continue to rally in a straight line. More basing activity is most likely needed. And that’s going to require more time.”
Did you enjoy this post? If so, click here to subscribe to updates to Investment Postcards from Cape Town by e-mail.
By Dr Prieur du Plessis
Dr Prieur du Plessis is an investment professional with 25 years' experience in investment research and portfolio management.
More than 1200 of his articles on investment-related topics have been published in various regular newspaper, journal and Internet columns (including his blog, Investment Postcards from Cape Town : www.investmentpostcards.com ). He has also published a book, Financial Basics: Investment.
Prieur is chairman and principal shareholder of South African-based Plexus Asset Management , which he founded in 1995. The group conducts investment management, investment consulting, private equity and real estate activities in South Africa and other African countries.
Plexus is the South African partner of John Mauldin , Dallas-based author of the popular Thoughts from the Frontline newsletter, and also has an exclusive licensing agreement with California-based Research Affiliates for managing and distributing its enhanced Fundamental Index™ methodology in the Pan-African area.
Prieur is 53 years old and live with his wife, television producer and presenter Isabel Verwey, and two children in Cape Town , South Africa . His leisure activities include long-distance running, traveling, reading and motor-cycling.
Copyright © 2009 by Prieur du Plessis - All rights reserved.
Disclaimer: The above is a matter of opinion and is not intended as investment advice. Information and analysis above are derived from sources and utilizing methods believed reliable, but we cannot accept responsibility for any trading losses you may incur as a result of this analysis. Do your own due diligence.
Prieur du Plessis Archive |
© 2005-2022 http://www.MarketOracle.co.uk - The Market Oracle is a FREE Daily Financial Markets Analysis & Forecasting online publication.