Fiat Currency in Circulation, How Much Money is There?
Currencies / Money Supply Jun 25, 2009 - 08:09 AM GMTBy: Mike_Hewitt
 There are several different monetary aggregates used to measure a nation's money supply. These monetary aggregates can be thought of as forming a continuum from most liquid (money as a means of exchange) to the least liquid (money as a store of value).
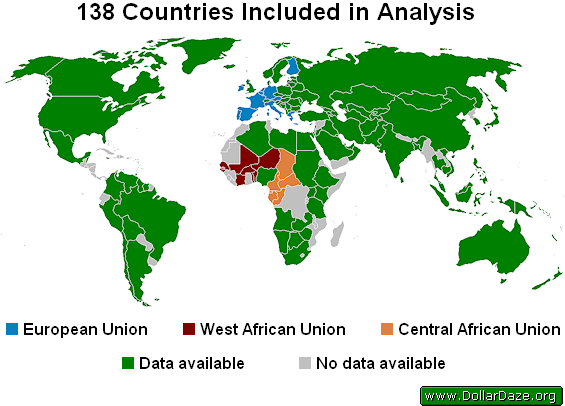
The following figure indicates compiled data for the most commonly used measures (M0, M1, M2 and M3) from 102 currencies representing 138 countries.

Three of the five monetary unions can be clearly seen above. The remaining two are the IEOM which uses the French Pacific Franc in three member countries, and the East Caribbean Currency Union which uses the East Caribbean Dollar in eight member countries.
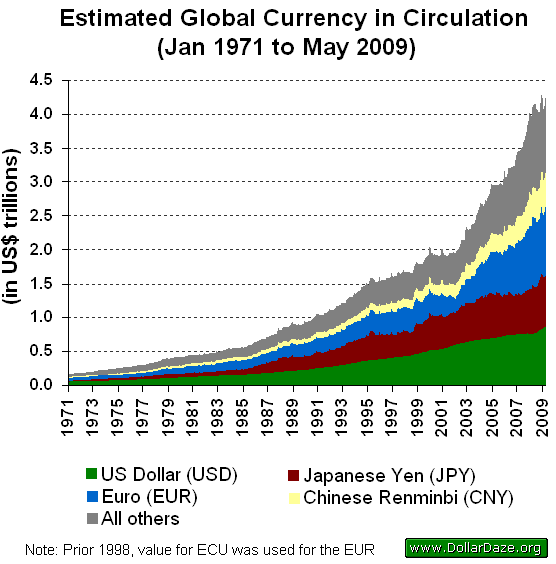
The following graph shows the growth of money supply since 1971, a year selected for the reason that the last remaining currency to be convertible to gold, that being the US dollar, was made inconvertible on Aug 15, 1971.

Currency in Circulation
Four currencies (EUR, USD, JPY and CNY) comprise nearly 75% of all circulating banknotes and coins within the public domain.
| Country/Union | Currency Code | Amount (Billion US$) |
Percent of all Circulating Currency |
|---|---|---|---|
| European Union | EUR | 1035.2 | 24.30% |
| United States | USD | 850.7 | 19.97% |
| Japan | JPY | 762.4 | 17.90% |
| China | CNY | 492.3 | 11.56% |
| India | INR | 140.3 | 3.29% |
| Russia | RUR | 110.8 | 2.60% |
| United Kingdom | GBP | 87.5 | 2.05% |
| Canada | CAD | 43.8 | 1.03% |
| Switzerland | CHF | 40.3 | 0.95% |
| Poland | PLN | 37.7 | 0.89% |
| Brazil | BRL | 37.3 | 0.88% |
| Mexico | MXN | 34.3 | 0.81% |
| Australia | AUD | 32.4 | 0.76% |
| Others (89) | - | 554.9 | 13.03% |
The following graph shows the historical outstanding stocks of M0 for currencies analysed in this essay.

It is apparent that the quantities of money are increasing in an accelerating fashion. In 1990, the total amount of currency in circulation passed US$1 trillion. Twelve years later, the total amount exceeded US$2 trillion. This doubled again less than six years later in early 2008.
The author is of the opinion that while we may likely experience a continual lowering of asset prices, the substantial increases to the money supply will lead to continuing higher prices for consumer goods.
This may lead to a view that both inflation and deflation are occurring simultaneously, but when one applies the classical definition of inflation - that being an increase to the money supply - such apparent discrepancies disappear.
By Mike Hewitt
http://www.dollardaze.org
Mike Hewitt is the editor of www.DollarDaze.org , a website pertaining to commentary on the instability of the global fiat monetary system and investment strategies on mining companies.
Disclaimer: The opinions expressed above are not intended to be taken as investment advice. It is to be taken as opinion only and I encourage you to complete your own due diligence when making an investment decision.
Mike Hewitt Archive |
© 2005-2022 http://www.MarketOracle.co.uk - The Market Oracle is a FREE Daily Financial Markets Analysis & Forecasting online publication.


