What’s Happening in Crude Oil?
Commodities / Crude Oil Jul 03, 2009 - 08:11 AM GMTBy: Seven_Days_Ahead
 The Macro Trader’s view:
The rally in oil from the beginning of the year always looked to us to be driven by speculation rather than fundamentals. In an environment where the global economy was still struggling to emerge from recession and supply was still plentiful, a rally of around $25 a barrel in two months seemed excessive.
We argued that traders were pricing in a recovery that had yet to materialise. It was in fact partly driven by memories of the last rally that saw oil peak at $145.00 a barrel before the financial crisis and recession hit.
We accept that once the global economy is truly in recovery mode long-term oil prices will rise, and the previous high may well be retested once the leading economies, including China and India are operating closer to full capacity. But that isn’t a scenario that is likely to emerge for some little while.
Currently the Euro zone looks in the grip of recession, with data only starting to look mixed at best, indeed in recent weeks industrial new orders have worsened.
In the UK the economy does seem to be closer to recovery and although Q1 GDP reversed going weaker earlier this week, that number is largely now historic. In the months since the data has improved and crucially the PMI Services report has moved back above 50. But the UK on its own will not move the oil price.
The US economy, the world’s largest energy consumer, is also showing signs of emerging from recession, but unemployment is still rising and as yet both ISM surveys, while improving, remain below 50.
And while optimism has picked up in Japan, as industrial production rose this week for the 3rd month running and the World Bank recently increased its growth forecast for China, the IEA has also recently lowered its estimate for oil demand for this year.
So, on balance, the leading economies appear to be over the worst, but the Fed and the Bank of England are sending out warnings that recovery will take time, due to the recession having its roots in a financial crisis rather than as a result of a straight forward demand deficiency.
So while interest rates look set to remain at current very low levels for a further period to help promote growth, which should also help support equities, we judge the oil market is due a deeper correction to bring it back in line with the current economic reality, and may well divorce itself from the price action in equities as we move forward.
The Technical Trader’s view:
 |
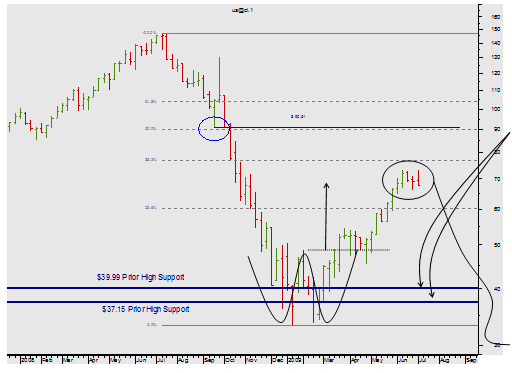
WEEKLY CONTINUATION CHART The market has bounced off the band of Prior High Support in a very convincing fashion. The Minimum move for the Double Bottom was just beneath $70. Where we are now. And there the market has paused. |
|
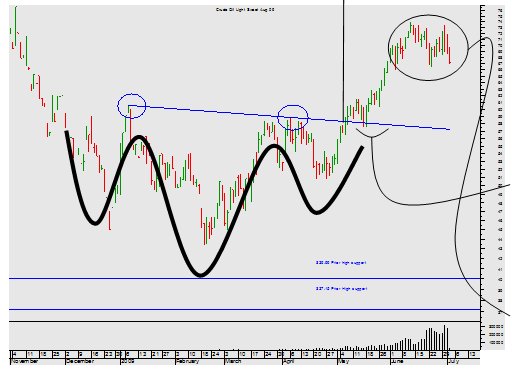
DAILY Aug 09 CHART This is possibly a Head and Shoulders reversal, notably different in any case to the continuation chart. The Neckline does seem to influence the market - see how the price action has bounced off the Neckline. But the crux of the matter surrounds the status of the present sideways price action. Look closer still. |
|
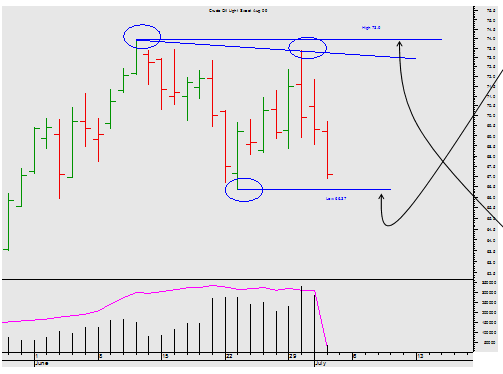
DAILY Aug 09 CHART A break of the low at $66.37 would be very critical for the market by creating good overhead resistance. Watch that level closely. Equally, a push up through the prior High at $73.9 would get the bulls going.
|
Mark Sturdy
John Lewis
Seven Days Ahead
Be sure to sign up for and receive these articles automatically at Market Updates
Mark Sturdy, John Lewis & Philip Allwright, write exclusively for Seven Days Ahead a regulated financial advisor selling professional-level technical and macro analysis and high-performing trade recommendations with detailed risk control for banks, hedge funds, and expert private investors around the world. Check out our subscriptions.
© 2009 Copyright Seven Days Ahead - All Rights Reserved
Disclaimer: The above is a matter of opinion provided for general information purposes only and is not intended as investment advice. Information and analysis above are derived from sources and utilising methods believed to be reliable, but we cannot accept responsibility for any losses you may incur as a result of this analysis. Individuals should consult with their personal financial advisors.
Seven Days Ahead Archive |
© 2005-2022 http://www.MarketOracle.co.uk - The Market Oracle is a FREE Daily Financial Markets Analysis & Forecasting online publication.


