


Peak to Trough Case Shiller and CAR Home Price Declines
Housing-Market / US Housing Jul 15, 2009 - 02:36 PM GMTBy: Mike_Shedlock

 The following charts were produced by my friend "TC" who has been monitoring California Association of Realtors (CAR) data, DQNews data, and Case-Shiller Data. Although individual cities topped at varying times, the top-10 and top-20 cities peaked in a June-July 2006 timeframe.
CAR and DQNews Data
DQNews Housing Data contains resale single family residences and new homes.
CAR Housing Data only contains resale single family residences
CAR Source: http://www.car.org/newsstand/newsreleases/
DQNews Source: http://wwwdqnews.com/
"TC" Writes:
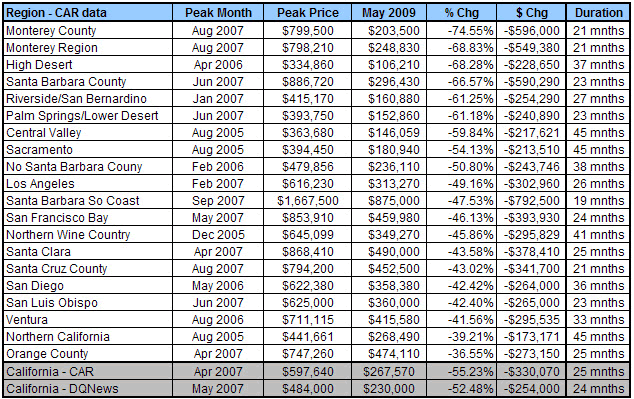
CAR – May 2009
Home prices in California gained slightly month-over-month in the non-seasonally adjusted CAR index, resulting in a disappointment for a state that was offering an additional $10,000 in tax rebates to purchase a home (7% - 8% the median home value). As of today, the state is no longer accepting applications as the $100 million alloted towards the $10,000 tax rebates has all been claimed. Median state prices have been more than cut in half and cities have declines varying from 37% to 75% peak-to-trough. This results in the median Californian having lost roughly $330,000 in just 2 years! In higher rent areas the price drops are even more staggering with Santa Barbara South Coast leading the way with a price drop of $875,000 in only a 1 ½ years!
This data does not use the Repeated Sales Methodology (as Case-Shiller does) and consequently can be biased based upon the sales pool. Additionally, the DQ News data includes the sale of new homes and resales; whereas the CAR data only includes resales.
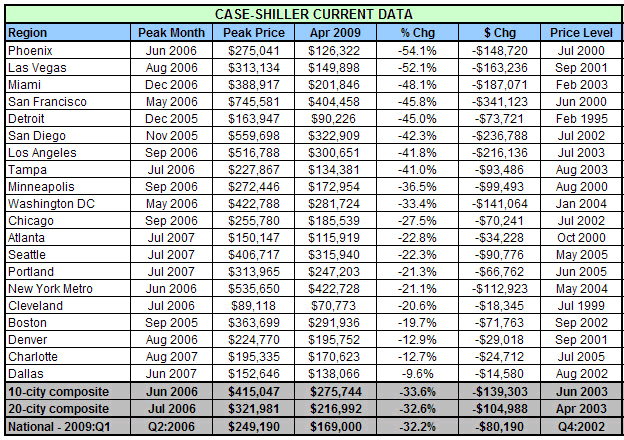
Case-Shiller Peak to Trough Declines Current Data
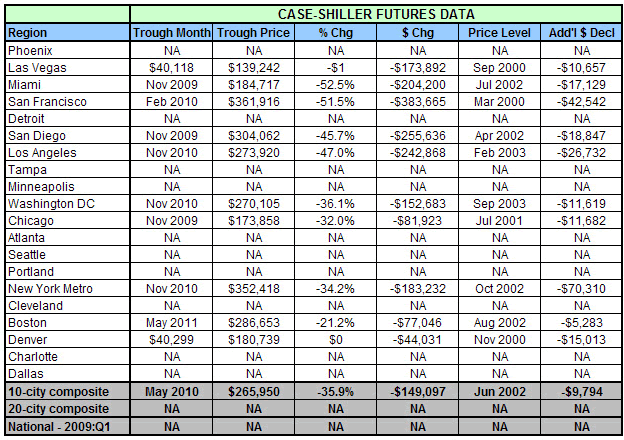
Case-Shiller Peak to Trough Declines Futures Data
"TC" writes:
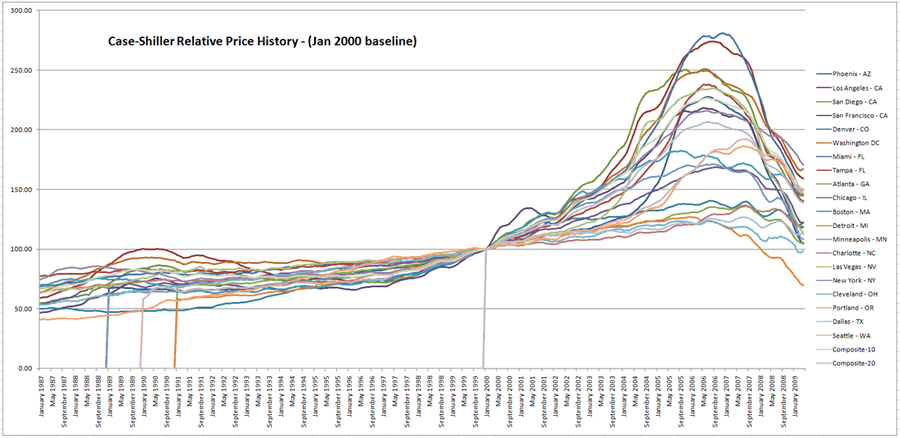
Home prices continue to decline (although the decline was at a slower pace) despite an $8000 federal tax credit nationally. Median national prices have now fallen 32% peak-to-trough over the past 3 years or $80,000. In the 20 cities that Case-Shiller tracks prices have fallen from 10% (Dallas) to 54% (Phoenix). Price declines are highest in CA, NV, AZ, FL and Detroit. In nearly all of the cities prices have now declined back to early 2000 prices and thinly traded futures data points to a bottom occurring in about 12 months.
It is important for readers to know that Case-Shiller uses a Repeated Sales Methodology (RSM) which provides the most accurate housing data available. Additionally, there are two newer columns titled "Price Level" which show both the last time prices were at the current level and what price level prices are projected to decline to based upon the CME Futures market.
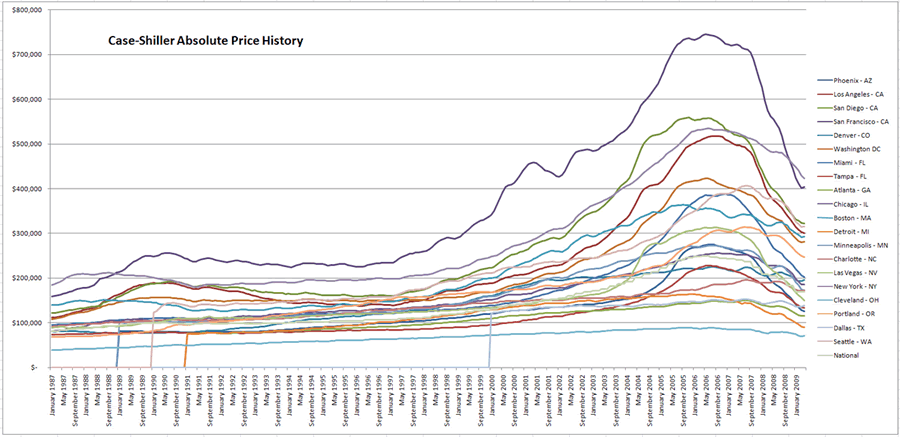
Lastly, this month I’ve included absolute and relative price charts. The relative charts are based upon a year 2000 equal point for the 20 cities and the absolute price chart helps to show the current price declines.
Case Shiller Absolute Price History
Case Shiller Relative Price History
Thanks to "TC" for another set of excellent charts.
This month the absolute and relative charts above are new. It is a bit hard to read 22 lines on each chart matching colors to cities so I have asked "TC" to consider putting 10 cities each (plus the composites) on the charts, doubling the number of charts (two charts each for absolute and relative performance).
By Mike "Mish" Shedlock
http://globaleconomicanalysis.blogspot.com
Click Here To Scroll Thru My Recent Post List
Mike Shedlock / Mish is a registered investment advisor representative for SitkaPacific Capital Management . Sitka Pacific is an asset management firm whose goal is strong performance and low volatility, regardless of market direction.
Visit Sitka Pacific's Account Management Page to learn more about wealth management and capital preservation strategies of Sitka Pacific.
I do weekly podcasts every Thursday on HoweStreet and a brief 7 minute segment on Saturday on CKNW AM 980 in Vancouver.
When not writing about stocks or the economy I spends a great deal of time on photography and in the garden. I have over 80 magazine and book cover credits. Some of my Wisconsin and gardening images can be seen at MichaelShedlock.com .
© 2009 Mike Shedlock, All Rights Reserved
Mike Shedlock Archive |
© 2005-2022 http://www.MarketOracle.co.uk - The Market Oracle is a FREE Daily Financial Markets Analysis & Forecasting online publication.