


Stock Market Breakout Move Underway...Eyeing 38-50% Retracement Levels
Stock-Markets / Stock Index Trading Jul 26, 2009 - 09:34 AM GMTBy: Jack_Steiman

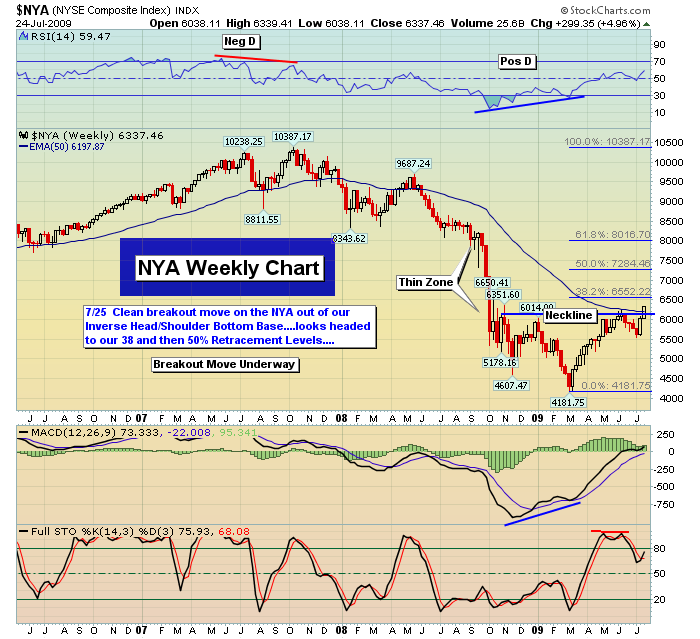
 All the major market indices that we track broke out in a big way this week through our important Neckline Pivots which now open the door for a move up to our 38 and 50% Retracement Levels. After breaking through the Neckline of an Inverse Head/Shoulder Pattern it's common to get some type of backtest move.
Should that occur we are now expecting strong buy Support to show up on any test back to our 956 SP 500 and 8800 Dow levels. Now that the breakout move has been made you can count on the bulls to put up a fight to defend those levels on backtests. With most of our Daily chart RSI's in the 70ish area you can never rule out a backtest move. Our Pattern breakout move projects a strong ways higher with our first targets being those 38 and 50% Retracement Levels which we will now lay out. The bears lost their edge on the break/rapid reversal at our 50 MA's a couple of weeks back and soon thereafter we noted a potential breakaway gap higher and so far the market has not looked back.
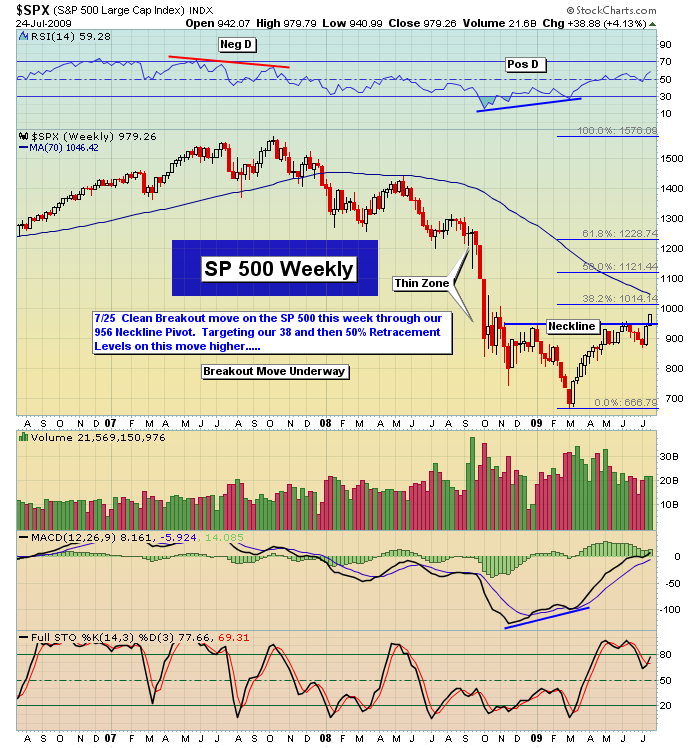
Looking at our first chart below of the SP 500 we can see a clean breakout move through our 956 pivot with little resistance up until the 1015 area. If you study our 3 Weekly charts below you can see that we're entering a pretty decent "Thin Zone" with little in the way of price Supports which should allow price to travel higher in time. Beyond our 38% retrace level our Declining 70 MA comes in around 1045 followed by our 50% retrace level at 1121.
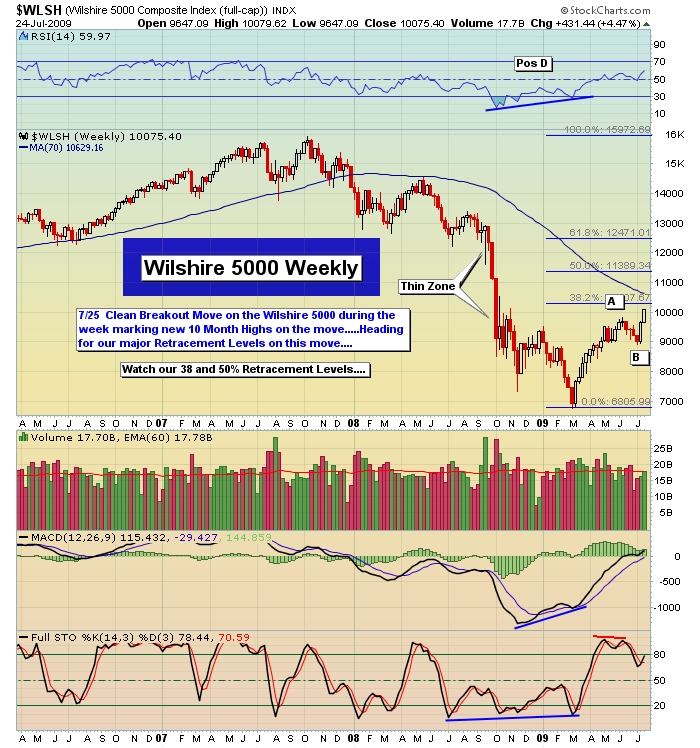
There is a strong confluence of resistance that flows through that 1100-1140 area that will prove difficult if we get that high on this move. Studying our 2nd chart below of the Wilshire 5000 (which we refer to as the "total market" we can also see a clean breakout move to new 10 Month Highs during the week. We look set for a move to our 38 and 50% retracement levels on this push higher. The NYA Weekly our 3rd chart below also made a clean breakout move this week through our Neckline area and also looks poised for a run at our 38 and 50% retracement levels.
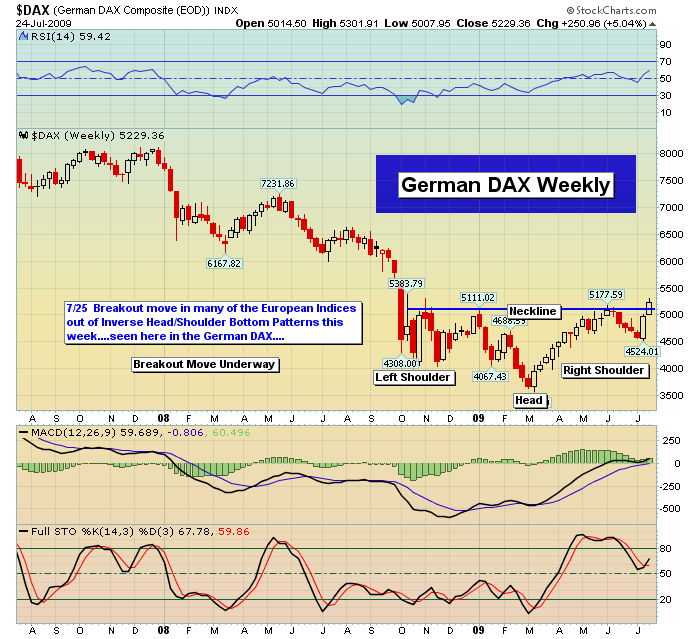
Most of the Major European Indices are following suit seen in our 4th chart of the German DAX which has broken out through its Neckline area and looks set for significantly higher levels in time. The Shanghai Index continues to make a beeline higher (chart not shown) and looks set to test our important 3,500 level soon.
Sentiment Analysis:
Adding fuel to the bull case here can be seen in this weeks release of the Investors Intelligence Data which comes out mid week. This week showed a spread of 36/35 Bulls to Bears a strong contrairian bullish number. Historically when the Bulls/Bears measure is flat to inverted its closely correolated to market bottoms and not tops. We expect some of the thick bearish sentiment to get wrung out before the market will become more vulnerable yet again. We expect pullback moves to be contained by the short interest covering on pullbacks near our 950-956 Neckline/Pivot. In addition, we have a tremendous amount of sideline case that will feel pressure to participate as the market heads higher further putting a squeeze on the bears.
Sector Watch:
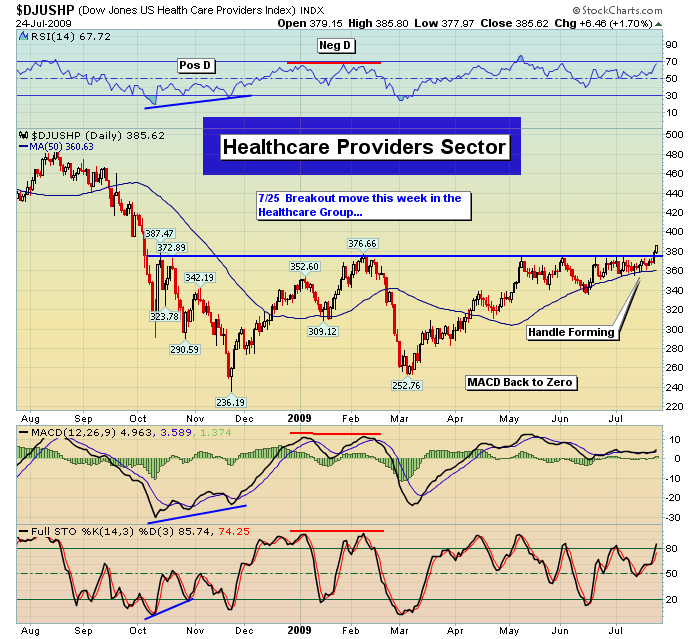
Thanks to strong earnings reports in the Technology area that group continues to lead this advance off the bottom. The Healthcare area broke out of a 10 Month Double Bottom Pattern w/Handle this week (see our 5th chart below). The Transports also broke out of a 3-4 month base this week. The Financial/Retail areas have both pockets of strength/weakness so we continue to pick our spots carefully in those areas.
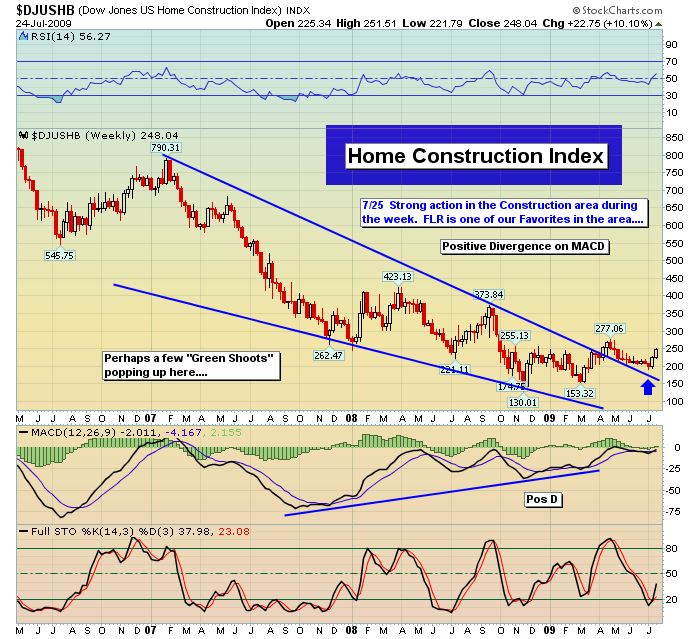
We are also seeing some strong numbers come from the Construction area and noted some nice moves in the group this week (see our 6th chart below). Thus, to sum the move higher in the market the past couple of weeks has been VERY broad based. We've added companies likeAo. Smith Corp. (AOS), Fluor Corp. (FLR),W.W. Grainger Inc. (GWW) andResearch In Motion Ltd. (RIMM) to our model portfolio.
The Week Ahead:
Thanks to some strong visibility from recent earnings reports our bias remains to position in the strongest earnings plays in the better sectors and if/when the sideline money comes into the market we expect our plays to continue to push higher. If we do get a backtest move towards our 956 SP 500 and 8800 Dow Supports/Neckline areas we will continue to add to our current exposure. Our Rising 20/50 MA's off our Daily Charts will soon approach our neckline areas adding further support to any pullback move in that area. Many individual stocks/sectors continue to setup in strong basing patterns and our scans show many setups and bases that should make solid advances in the weeks ahead.
Have a Great Weekend!
Peace
Jack Steiman
Jack Steiman is author of SwingTradeOnline.com ( www.swingtradeonline.com ). Former columnist for TheStreet.com, Jack is renowned for calling major shifts in the market, including the market bottom in mid-2002 and the market top in October 2007.
Sign up for a Free 30-Day Trial to SwingTradeOnline.com!
© 2009 SwingTradeOnline.com
Mr. Steiman's commentaries and index analysis represent his own opinions and should not be relied upon for purposes of effecting securities transactions or other investing strategies, nor should they be construed as an offer or solicitation of an offer to sell or buy any security. You should not interpret Mr. Steiman's opinions as constituting investment advice. Trades mentioned on the site are hypothetical, not actual, positions.
Jack Steiman Archive |
© 2005-2022 http://www.MarketOracle.co.uk - The Market Oracle is a FREE Daily Financial Markets Analysis & Forecasting online publication.