


Stock Market Head and Shoulders Pattern Failure
Stock-Markets / Cycles Analysis Jul 27, 2009 - 03:33 AM GMTBy: Clif_Droke

 The dangers of drinking from the horse trough -
One of the most talked about themes of the past few weeks was the supposedly bearish “head and shoulders” pattern in the daily chart of the S&P 500 Index. The financial press drew investors’ attention to this pattern in the most alarmist tones they could muster. A plethora of market technicians were trotted out each day to remind one and all that this “H&S top” was a precursor of a major decline, if not an outright collapse.
The dangers of drinking from the horse trough -
One of the most talked about themes of the past few weeks was the supposedly bearish “head and shoulders” pattern in the daily chart of the S&P 500 Index. The financial press drew investors’ attention to this pattern in the most alarmist tones they could muster. A plethora of market technicians were trotted out each day to remind one and all that this “H&S top” was a precursor of a major decline, if not an outright collapse.
Yet as is all too often the case in when the major Kress cycles are rising, the media’s pessimism was misplaced. This is one of the dangers of drinking from the proverbial horse trough. When everyone is getting information from the same sources, the information tends to have only marginal value and can’t be profitably utilized in most instances. Fear tends to spread rampantly among financial market participants when the media is fanning the flames, as they’ve done all summer.
Market participants are immersed in the daily wash of the news media. They are subject to the constant vagaries and cross-currents of continued – and conflicting – news reports on an hourly basis, day after day. This constant “drinking from the horse trough” often results in poor judgment. This summer it has done nothing but create a lingering sense of pessimism and has made rational, unbiased assessment of market conditions all but impossible.
As proof of this homogeneity of thought, witness the prolonged decline in retail investor sentiment since late 2007. While such a gloomy outlook may well have justified in 2008, no such justification can be made for the negative investor outlook in the face of the impressive recovery this year. Yet despite the continued uptrend in stock prices since March, investors have grown increasingly pessimistic, which has resulted in an inverse correlation between sentiment and the rise in the major market indices.
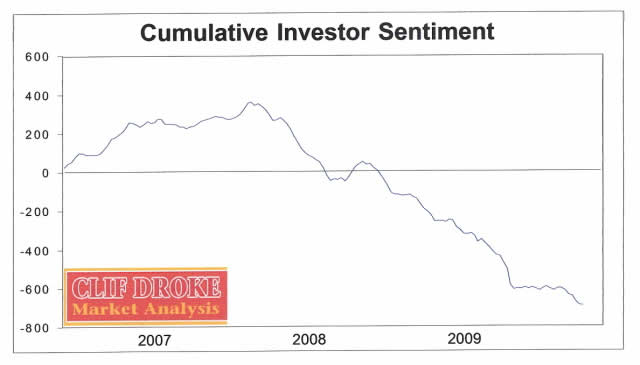
In a year in which the dominant yearly cycle is in decline, as was true in 2008, negative sentiment and bad news tend to create a self-fulfilling prophecy. Certainly we saw this during last year’s credit storm while the 6-year cycle was in its “hard down” phase. In contrast, when the dominant yearly cycle is rising along with its sub-dominant counterpart bad news tends to create a “wall of worry” for the market, allowing it to rise in the face of increasing fear. The upward pressure the dominant yearly cycle exerts against stock prices is fueled by the increase in short interest whenever investor fear grows. And where does the growth of investor fear come from if not the mainstream press?
Indeed, the daily servings of doom and gloom from the press are liberally poured into the horse trough each and every day for millions of misguided investors to drink from. If there’s anything we’ve learned from these media proclamations over the years it’s that taking such statements too seriously is usually hazardous to one’s financial health. To be sure, drinking from the horse trough is a dangerous business and one to be avoided at all costs. No news at all is better than mainstream news. The best “news” comes from the tape anyway.
The broad market continues to plow its way through earnings season with a plethora of upside surprises, much to the consternation of the pessimistic crowd. The S&P 500 Index (SPX) closed at a new recovery high for the year of 979 on Friday, July 24. The NASDAQ 100 (NDX) closed the week at 1,599 and just two points below its year-to-date high, which was made on Thursday. The NYSE Composite Index (NYA) finished the week also at a recovery high of 6,337.
The latest AAII investor sentiment poll showed once again that the bears outnumbered the bulls, with 42 percent of investors bearish versus 38 percent bullish. This marks the sixth consecutive week that there have been more bears since bulls, a feat not seen since the previous low in early March. Yet unlike the January-February experience, the broad market is actually in an uptrend this time around. Despite the continued rise in the market and the proliferation of upside earnings surprises, everyone seems to be negative on the market’s outlook. Once again the market has done its job of faking out the conventional wisdom of retail investors.
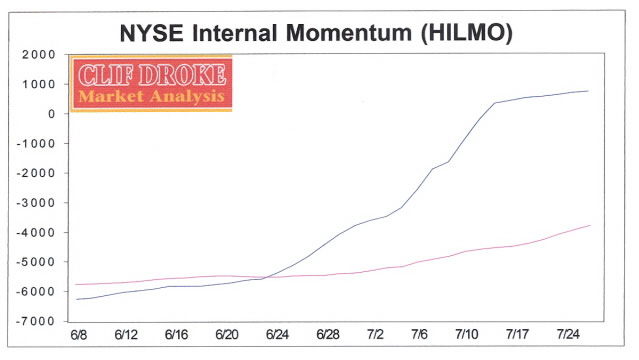
As discussed previously, the internal momentum has been up strongly for the NYSE broad market and in particular for the tech stocks all summer. Until last week there was much talk among analysts about the “alarming lack of momentum” but what these analysts failed to take into account was the powerful internal momentum of the broad market on an intermediate-term as well as a longer-term basis (see chart below). There hasn’t been a meaningful pullback yet but at some point investors will finally capitulate to the uptrend and jump on the bullish bandwagon. When this happens we’ll likely see a temporary halt to the rise in the tech stocks followed by a corrective pullback.
Already there are signs that some capitulation to the uptrend among investors is taking place. For weeks investors refused to believe the market could go higher; instead they preferred to focus on the “head and shoulders” pattern in the Dow and S&P indices. But as we’ve seen all too many times in the past, whenever conventional wisdom focuses on a supposedly bearish chart pattern within the context of a bull market recovery, the chart pattern more often than not turns out to be a bullish continuation pattern. This was the case for the latest H&S pattern in the SPX.
Turning to the natural resource sector, the XAU Gold Silver Index remained above the dominant immediate-term 15-day moving average as well as the sub-dominant 5-day moving average on Friday as shown in the daily chart. The immediate uptrend therefore remains intact in spite of the short-term overbought condition of the market.
The reason the mining stocks have for the most part lagged the broad market recovery is due to the fact that the internal momentum for the gold and silver stocks is quite a bit muted compared to that of the NYSE broad market (particularly the red hot tech stocks). There is enough buoyancy in the gold/silver momentum indicators, though, to keep the recovery alive and allow the relative strength leaders among the PM stocks to work their way higher. Below is the GOLDMO series of internal momentum indicators for the gold stocks.
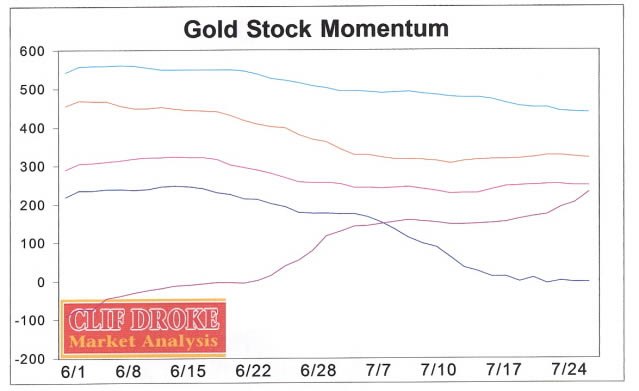
For the recovery in the gold stocks to have longevity, the dominant interim internal momentum indicator (light blue line in above chart) should reverse its decline. The dominant longer-term momentum indicator shown near the bottom of the chart has been the main pillar of support for the gold stock recovery to date, an observation we’ll expand on in upcoming reports.
By Clif Droke
www.clifdroke.com
Clif Droke is the editor of the daily Gold & Silver Stock Report. Published daily since 2002, the report provides forecasts and analysis of the leading gold, silver, uranium and energy stocks from a short-term technical standpoint. He is the author of several books on financial markets, including “Channel Buster: How to Trade the Most Profitable Chart Pattern.” For more info visit www.clifdroke.com .
Clif Droke Archive |
© 2005-2022 http://www.MarketOracle.co.uk - The Market Oracle is a FREE Daily Financial Markets Analysis & Forecasting online publication.