


Stock Market On Breakout... Possible Back Test Coming...
Stock-Markets / Stock Index Trading Aug 02, 2009 - 08:46 AM GMTBy: Jack_Steiman

 Market Overview - For weeks, and for that matter months, we saw the market race off the bottom at SP 500 666. Day after day and week after week we saw the market move higher, taking out important level after important level of resistance. Each one of those resistance levels bought about pullbacks that seemed to test the grit of every bull on Wall Street. We'd fail at various resistance levels once and then twice and sometimes three or more times.
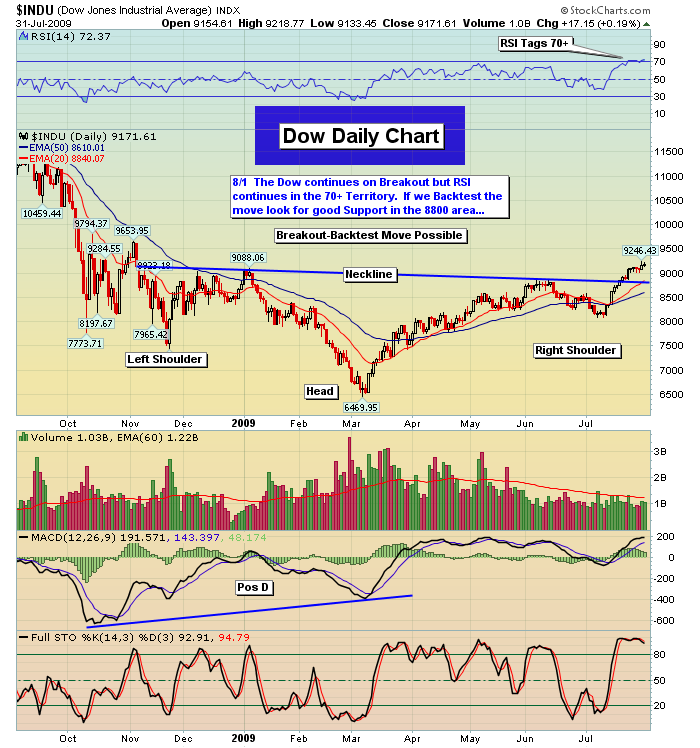
The more failures we saw the faster folks became bearish. That bearish attitude allowed the markets to finally make it through and move higher still. Just too many shorts in the market. We never thought we'd see the day we'd take out that nasty 875 neckline of resistance. Can you all remember how many attempts it took by the bulls to get through? We did get through though didn't we! Then we got to SP 500 956 or a very nasty neck line of resistance. A few failures and bang, through we went. On the way to getting through we saw some of the most overbought conditions in years on all time frames.
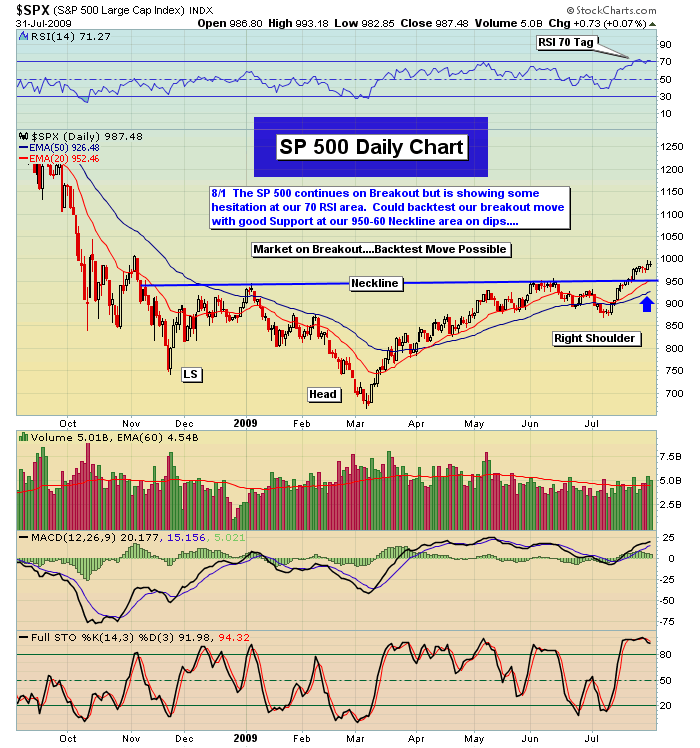
Overbought not only in terms of the oscillators but in terms of time. Stochastic's in the upper 90's to near 100 with rsi's at or above 70. Staying severely overbought for weeks only to see a little selling come in and unwind the 60 minute time frame charts but not even close to unwinding the daily charts. Just not enough selling. The moment the 60's get unwound enough we saw the buyers come right back in leaving the daily's with stochastic's and rsi's still basically at the top. We have that very condition still in place on the those daily's. Now, it's quite normal for a market to go back and test a breakout once we get overbought enough. That has yet to happen but there are indications that this may, I say may happen shortly. We had a gap up yesterday out of the latest bull flag pattern but it saw a nasty tail late. The good news was we didn't just see a gap down today but we saw yet another long tail down late during todays session. Two long tails in a row may be an indication that some back testing may be at hand.
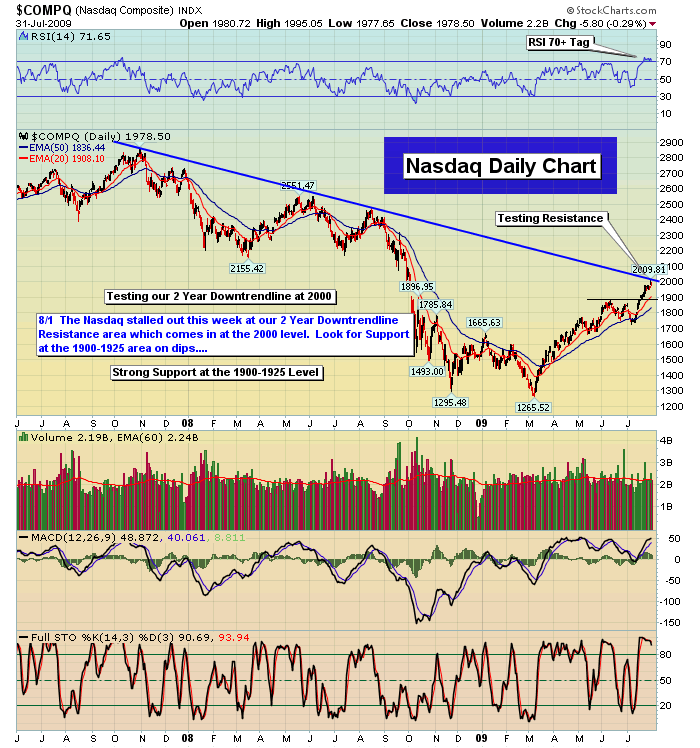
Add in the reality that we are close to Nasdaq 2000 which also happens to be the two year down trend line of resistance for the bulls (see our 3rd chart below). A very tough level of resistance for sure and with the market being so overbought, it may finally be time for a back test. Being we're long some plays it doesn't really excite us but that's the game. Some stocks were set up beautifully and should handle any selling without too much of a headache but being under water a few plays may be the case for some days. It served us very well playing overbought thus at some point it's bound to catch up and give us some headaches for a while.
Having exposure on a buy signal is always appropriate thus it's part of the game when the market finally goes against you for a few days. The selling should be contained by the 956 backtest area, if it even gets that low on the Sp 500 (see our 1st chart below). From there the market should be ready to move higher once again as there are no sell signals in place, only buy signals for now.
We started out slightly higher today after pulling back some pre market on some outstanding futures. The Advanced Gdp report was good on Q2 but the revisions were poor thus the Sp futures, once up 7 points, went red by 2. Once the market actually opened, we opened flat although it didn't take long for the bid to come right back in to this market. Any selling got swept up by the bulls. We headed towards that magical Nasdaq 2000 trend line level once again but that's when the market put in its second straight long tail off that area in two consecutive days. Not great action. A tired market. It's taken a lot of energy to get to this trend line and the bears once again are fighting with all their energy to keep the Nas below 2000.
The internals were fine today but technology stocks led down as the day moved along. Nothing horrific but sellers at Nas 2000 took down the leaders in that sector well off their highs. Attack the leaders or the most heavily weighted stocks if you want to defend as the bears did. Commodity stocks and Financial stocks did hold up well however, keeping the market from being hit too hard to the down side. Rotation is the name of this game for now. As long as money is rotating and not leaving the market, all is good. As individual sectors get overbought, money rotates elsewhere, leaving a bid in the market. This is bullish overall action. It has been the game since the bear bottomed at Sp 666. It still continues on, even at Sp 990 or thereabouts.
Sentiment Analysis
Bulls are increasing in numbers but nowhere near anything that resembles a problem for the market. There is still plenty of bearishness out there to keep the market moving higher overall, pullbacks not withstanding. Major reliable surveys show the bulls are now in front of the bears in terms of percentages but only by a little bit. Bears were actually ahead for a while and that is a major reason why the market has gone higher when no one thought possible. For now the sentiment is still on the side of the bulls. The put call ratio one day can print .50's which shows too much bullish action but the next day will print levels over 1.00 which shows too much bearishness. No trend in place and that's good for the bulls. Overall, the action is without trend, with the bulls certainly not getting too aggressive. Good news for the bulls for sure.
Sector Analysis
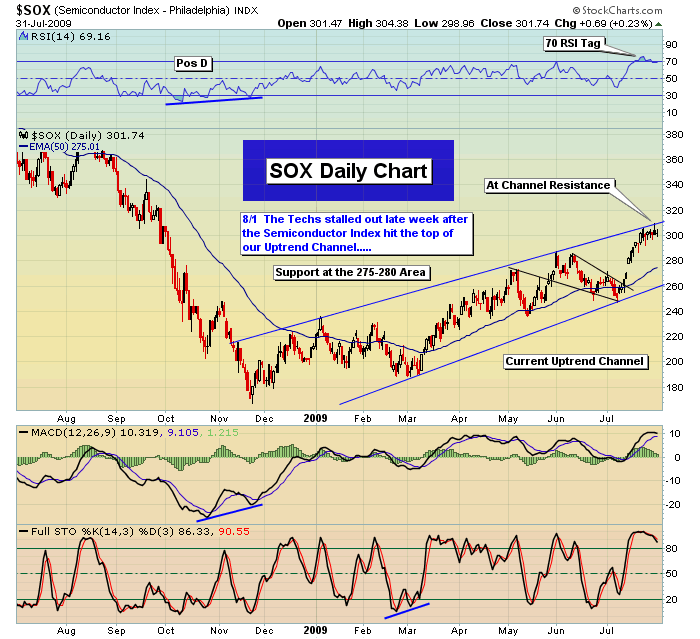
The Technology area which has led the advance off the March Lows finally took a well deserved breather late week after tagging our 2000 2 Year Nasdaq Downtrendline Resistance. Seen in our 4th chart below the Semiconductor Index which often leads the Techs tagged its Uptrend Channel Top resistance and stalled there late week. We would not be surprised to see some near term breathers/corrective moves in the Techs while money continues to rotate to other areas.

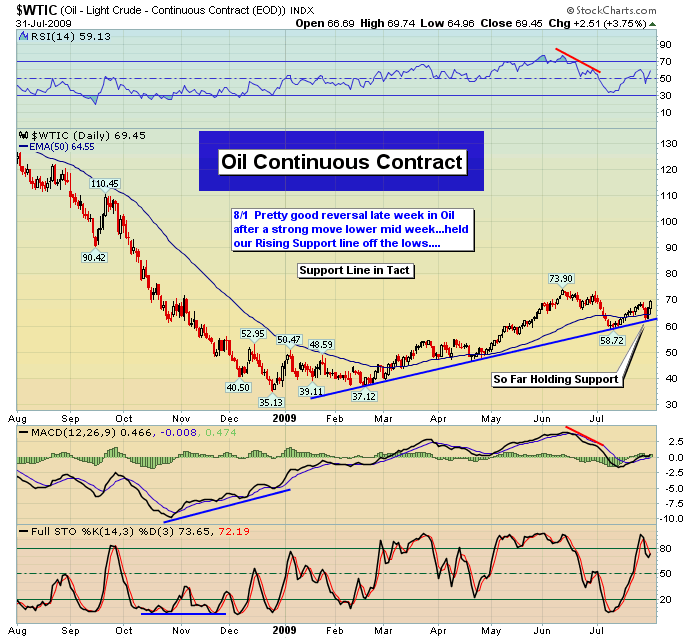
The Transports and Financials held up well seeing money flow during Fridays session. In addition, the Commodity area also caught some good flow with many stocks in the group 2-3%. Oil mid week tested and firmed off its Rising Support Line off the March lows (see our 5th chart below). The Metals/Mining Group also caught a sharp bid thanks to a move lower in the Dollar and bid in most Metals (see our 6th chart below the the XME which is setting a Handle off its 3 Month base.) Thus to sum, while the market looks like it may consolidate/pullback given our very overbought move and extended move we expect it to be more of a rotational move rather than money leaving the broad market.
The Week Ahead
The week ahead holds the potential for some selling early on as again, we are dealing with two long tails down off the Nasdaq 2000 2 year down trend line. With the 20 day exponential moving average curling up rapidly on the SP 500, now near 953, that adds more support to that 956 trend line which is now massive support. When an important moving average catches up to horizontal price support, such as 956 is, it gets tougher and tougher for the bears to break things down.
Buyers come in big time at those back tests, especially when they have the 20 day exponential moving average to help them. It doesn't have to go that low, as money keeps rotating, but the potential is there for some selling so try not to get too upset if our current longs take a hit for a few days. They should be fine, as most of our plays have been for a long time. We're far from perfect but you all know the record speaks for itself. Please just try to be patient. The market is till on an overall major buy signal.
Have a Great Weekend!
Peace
Jack Steiman
Jack Steiman is author of SwingTradeOnline.com ( www.swingtradeonline.com ). Former columnist for TheStreet.com, Jack is renowned for calling major shifts in the market, including the market bottom in mid-2002 and the market top in October 2007.
Sign up for a Free 30-Day Trial to SwingTradeOnline.com!
© 2009 SwingTradeOnline.com
Mr. Steiman's commentaries and index analysis represent his own opinions and should not be relied upon for purposes of effecting securities transactions or other investing strategies, nor should they be construed as an offer or solicitation of an offer to sell or buy any security. You should not interpret Mr. Steiman's opinions as constituting investment advice. Trades mentioned on the site are hypothetical, not actual, positions.
Jack Steiman Archive |
© 2005-2022 http://www.MarketOracle.co.uk - The Market Oracle is a FREE Daily Financial Markets Analysis & Forecasting online publication.