


Stock Market Counter Trend Rally Coming to an End
Stock-Markets / Stocks Bear Market Aug 16, 2009 - 04:25 PM GMTBy: Andre_Gratian

 Current Position of the Market
SPX: Long-term trend - Down! The very-long-term cycles have taken over and if they make their lows when expected, the bear market which started in October 2007 should continue until 2012-2014. This would imply that much lower prices lie ahead. This will not be a straight-down decline, but a series of intermediate-term rallies and declines until we have reached the low point.
SPX: Intermediate trend - The counter-trend rally which started in March is now coming to an end. The objective for a high is being reached and deceleration is becoming apparent. If the top has not already been reached, it should be, shortly!
Analysis of the short-term trend is done on a daily basis with the help of hourly charts. It is an important adjunct to the analysis of daily and weekly charts which determines the course of longer market trends.
Daily market analysis of the short term trend is reserved for subscribers. If you would like to sign up for a FREE 4-week trial period of daily comments, please let me know at ajg@cybertrails.com .
Overview:
Ever since it reached my projection of about 1000, two weeks ago, the SPX has gone essentially sideways. In the last newsletter, I also mentioned that we had reached an area of resistance. That, too, was apparently correct. What has not yet proven out is that long term cycles should be turning down in this time frame, although that was the prognostication.
The SPX reached 1018 on 8/7 and has been trading in a narrow range since, finding support just above 992. In order to reverse its trend, the index should close below this level decisively.
Some Elliott wave analysts have also tagged this area for the high of the rally which started in March. Robert Prechter of EWI recently re-affirmed the vulnerability of the market at these levels, warning that the next move could potentially take it back down to the recent lows.
Some EW counts call for the market to move a little higher and this is certainly possible, but the volume pattern of the DJIA during this entire rally should give the bulls some concern. It has been a steady decline from the beginning -- not a bullish pattern!
On the other hand, as we will see later, the NYSI is still making new highs along with price. In other words, there is enough ambiguity to refrain from calling for a top to the counter-trend rally until we begin to see a clear reversal.
What's ahead?
Chart Pattern and Momentum
The weekly chart shows little change from two weeks ago. The index has stopped making new highs and has preserved its bearish wedge pattern. The indicators are overbought and some minor negative divergence has begun to appear in the histogram. A lower close next week could easily generate a sell signal in the indicators.
The daily chart (below) shows how the SPX found resistance at the top of its wedge pattern. The small red horizontal line drawn at the 992 level must be broken for a reversal to occur. But for a confirmation of a major reversal, we would have to move down through the 30 and 50 DMAs, and the green uptrend line which represents the lower boundary of the wedge pattern. This could take some time to unfold!
All the indicators show negative divergence. The lower (A/D) oscillator, has been in a declining pattern for about a month, and the two above (momentum) are finally beginning to follow it. I mentioned some time ago that the type of rounding top formation we were making might take some time to complete. This is proving to be so.
The last leg of the rally has been primarily fueled by encouraging earnings and economic reports which have created the perception that the recession is behind us and that a new bull market is under way. It will take some signs that this is a false perception to reverse this trend. Friday's lower than expected consumer confidence reading could be the beginning of a re-assessment of reality.
The hourly chart (above) gives us a chance to examine more closely the potential top formation that is taking place. After making its high of 1018, the index broke an uptrend line and retested the 992 support level. It subsequently went back up to find resistance on the underside of that trend line, and on Friday sold off one more time on the lower than expected Confidence Index report, found support at the former lows, and rallied into the close.
The two levels of support, one at 995, and the other at 992, have contained prices on the downside since 8/5. They will have to give way the next time they are tested for a reversal to occur. This coming week offers such an opportunity with a short-term cycle bottoming on Monday and another at the end of the week.
Cycles
There is a minor cycle bottoming on Monday, and a somewhat more important one at the end of the week.
This is the time period when longer-term cycles have been slated to start rolling over into next year, and we could have some evidence that this has started. But until we have a definite reversal, we cannot make that claim with a great deal of confidence.
Projections:
The primary projection was to about 1000. The index, thus far, has peaked at 1018. We don't expect longerterm projections made several weeks in advance to be exact, although they often are. If they are exceeded by a good margin, as this one was, this may be a sign that we are not quite done with the move and that another move higher may be coming. Since the short-term cycles are still pushing down, there is a better chance that we will break support first and move down to an initial projection of about 980-982.
Breadth
The McClellan summation index below (courtesy of StockCharts) has made a new high, which confirms the move made by the price index, but by the same token, not only is this the 3rd and probably the final wave of this index, but the RSI is both overbought and showing negative divergence. This is an indication that we have arrived (are arriving) at the top of this move, and that this will not only affect this index but the SPX as well.
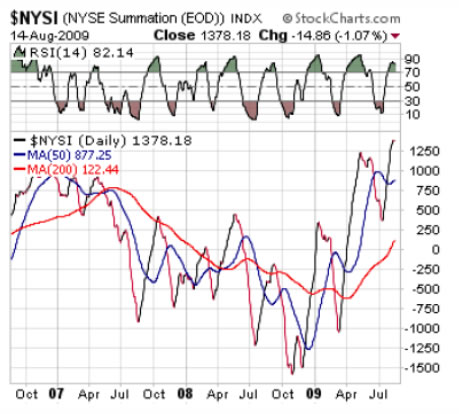
The daily breadth readings are showing negative divergence relative to price.
Market Leaders and Sentiment
The NDX/SPX ratio (courtesy of StockCharts) continues to predict a potential end to the relative strength of the NDX over the SPX .
Here is another interesting chart: Goldman Sachs has been a market leader in this rally. This is a snap-shot of its current hourly chart. I am not fond of head & shoulder patterns because they fail so often, but what makes this one compelling is the little blow-off spike at the head. It just adds to the other signs that we may be at an important market juncture, especially if the H&S turns out to be valid.
Summary
This is what I wrote two weeks ago for a summary:
The list of signs that the move from 667 is running out of steam is very long and the projection of about 1000 which had been made for the top of the rally has essentially been reached.
Nevertheless, short-term conditions do not call for an immediate reversal, and the SPX could still make a slightly higher high before beginning a long decline into 2010.
If we do make a top in this area, it is more likely to be a slow roll-over than an immediate plunge.
I see no reason to change a single word of it.
Overview:
The following are examples of unsolicited subscriber comments:
Awesome calls on the market lately. Thank you. D M
Your daily updates have taken my trading to the next level. D
… your service has been invaluable! It's like having a good technical analyst helping me in my trading. SH
I appreciate your spot on work more than you know! M
But don't take their word for it! Find out for yourself with a FREE 4-week trial. Send an email to ajg@cybertrails.com .
By Andre Gratian
MarketTurningPoints.com
A market advisory service should be evaluated on the basis of its forecasting accuracy and cost. At $25.00 per month, this service is probably the best all-around value. Two areas of analysis that are unmatched anywhere else -- cycles (from 2.5-wk to 18-years and longer) and accurate, coordinated Point & Figure and Fibonacci projections -- are combined with other methodologies to bring you weekly reports and frequent daily updates.
“By the Law of Periodical Repetition, everything which has happened once must happen again, and again, and again -- and not capriciously, but at regular periods, and each thing in its own period, not another’s, and each obeying its own law … The same Nature which delights in periodical repetition in the sky is the Nature which orders the affairs of the earth. Let us not underrate the value of that hint.” -- Mark Twain
You may also want to visit the Market Turning Points website to familiarize yourself with my philosophy and strategy.www.marketurningpoints.com
Disclaimer - The above comments about the financial markets are based purely on what I consider to be sound technical analysis principles uncompromised by fundamental considerations. They represent my own opinion and are not meant to be construed as trading or investment advice, but are offered as an analytical point of view which might be of interest to those who follow stock market cycles and technical analysis.
Andre Gratian Archive |
© 2005-2022 http://www.MarketOracle.co.uk - The Market Oracle is a FREE Daily Financial Markets Analysis & Forecasting online publication.