


Wave of Foreclosures About to Break U.S. Housing Market Dam
Housing-Market / US Housing Aug 17, 2009 - 02:37 AM GMTBy: Mike_Shedlock

 A summary of Second Quarter 2009 Negative Equity Data from First American CoreLogic shows that Nearly One-Third Of All Mortgages Are Underwater.
• More than 15.2 million U.S. mortgages, or 32.2 percent of all mortgaged properties, were in negative equity position as of June 30, 2009 according to newly released data from First American CoreLogic. As of June 2009, there were an additional 2.5 million mortgaged properties that were approaching negative equity. Negative equity and near negative equity mortgages combined account for nearly 38 percent of all residential properties with a mortgage nationwide.
• The aggregate property value for loans in a negative equity position was $3.4 trillion, which represents the total property value at risk of default. In California, the aggregate value of homes that are in negative equity was $969 billion, followed by Florida ($432 billion), New Jersey ($146 billion), Illinois ($146 billion) and Arizona ($140 billion). Los Angeles had over $310 billion in aggregate property value in a negative equity position, followed by New York ($183 billion), Miami ($152 billion), Washington, DC ($149 billion) and Chicago ($134 billion).
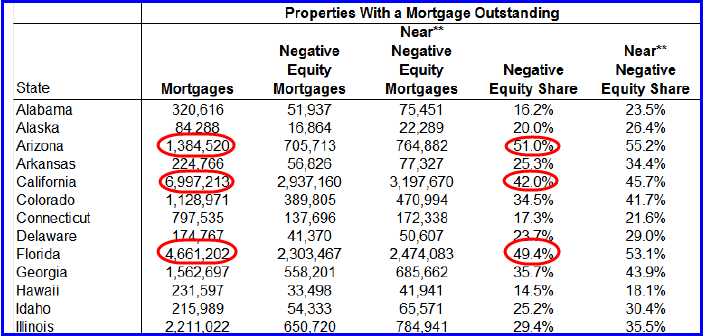
• The distribution of negative equity is heavily skewed to a small number of states as three states account for roughly half of all mortgage borrowers in a negative equity position. Nevada (66 percent) had the highest percentage with nearly two‐thirds of mortgage borrowers in a negative equity position. In Arizona (51 percent) and Florida (49 percent), half of all mortgage borrowers were in a negative equity position. Michigan (48 percent) and California (42 percent) round out the top five states.
There are some interesting tables and graphs in the article that inquiring minds are investigating. Here are some partial alphabetical lists.
Negative Equity Share
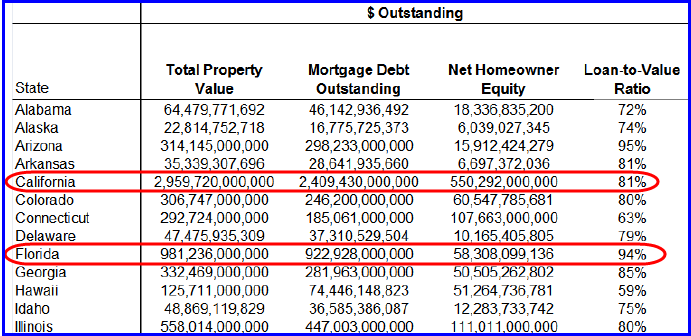
Property Values and Loan-To-Equity Ratios
Nevada, not shown has a near-negative equity share of 68.9% and a Loan-To-Value ratio of a whopping 115%!
It is disingenuous to say there are only a half-dozen or so problem states, when the problem states are where people live. It is wrong to treat Alabama and Alaska the same as California or Florida.
Mortgage Facts and Figures - Select States
- California has $2.4 trillion in mortgages debt. 42.0% of the properties have negative equity.
- Florida has $923 billion in mortgage debt. 49.4% of the properties have negative equity.
- Illinois has $447 billion in mortgage debt. 29.4% of the properties have negative equity.
- Arizona has $298 billion in mortgage debt. 51.0% of the properties have negative equity.
- Nevada has $149 billion in mortgage debt. 65.6% of the properties have negative equity.
- Nationwide there is $10.1 trillion in mortgage debt. 32.2% of the properties have negative equity.37.6% of the properties have "near-negative" equity.
32-37% Of All Mortgage Holders Are Stuck, Unable To Sell
Take a look at that first line. California has $2.4 trillion in mortgages debt. 42.0% of the properties have negative equity. Think Wells Fargo (WFC) sitting on its massive share of California pay-option-arms is "Well Capitalized"? If so, think again.
Now take a look at that last line again. Nationwide there is $10.1 trillion in mortgage debt. 32.2% of the properties have negative equity, another 5.4% are nearly underwater. Counting real estate commissions of 5% or so, 37.6% are effectively underwater right now.
Unless those people bring equity to the table at closing, those mortgage holders are stuck in their houses, unable to sell.
And the situation is about to get worse. It will only take a small drop in the Case-Shiller home price index to put a whopping 50% of mortgage holders underwater, stuck in their houses, unable to sell.
Foreclosure Wave Is About To Hit
The biggest factor in foreclosures and walk-aways is whether or not someone is underwater. If someone with equity always has a chance to sell. The second biggest factor is "skin in the game". Those who put down 20% are far less likely to abandon their properties than someone who put down 10% or less.
In light of the above, and given the preponderance of "liar loans" and low down payments in the problem states, those thinking clearly might be expecting to see a giant wave of foreclosures striking shore right about now. And they would be correct.
Mark Hanson discusses the above theory in “The Foreclosure Wave” — Now a Tsunami of Sorts.
There's plenty of commentary in the article worth reading so please take a look. Here are some charts.
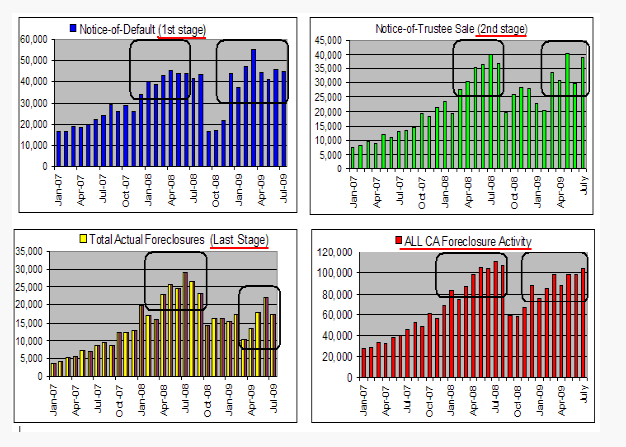
California Foreclosures
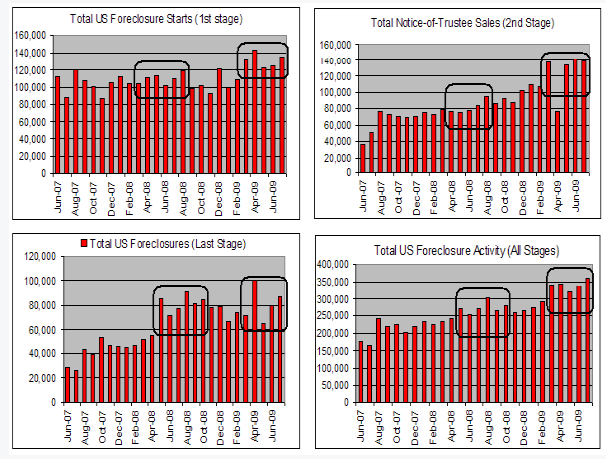
Nationwide Foreclosures
California Pent Up Foreclosure Demand
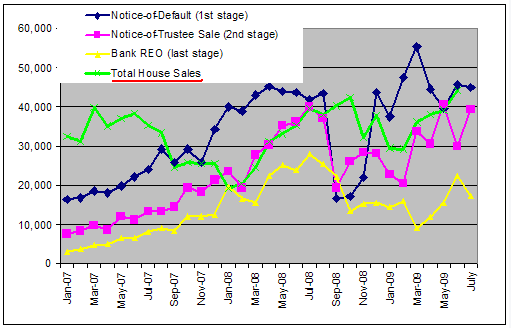
Mark notes "Foreclosure supply (yellow) has been artificially held back, which has allowed the low end of the real estate market to perform very well over the past several months. But the reservoir of foreclosures (blue + pink) is getting full and at some point the dam will crack and break."
Six Reasons the Dam Will Break Sooner Rather Than Later
- The number of people underwater in their mortgages is high and rising fast.
- The reported nationwide unemployment figure is 9.4% with the real unemployment above 16% and rising.
- Wages are falling.
- The jobs market will suffer losses for another year.
- Notices of Default and Trustee Sales are high and rising.
- Social attitudes towards walking away and bankruptcy have changed.
In light of the above, those expecting a rebound in home prices and consumer sales, and/or a sharp V-shaped recovery are in Fantasyland.
By Mike "Mish" Shedlock
http://globaleconomicanalysis.blogspot.com
Click Here To Scroll Thru My Recent Post List
Mike Shedlock / Mish is a registered investment advisor representative for SitkaPacific Capital Management . Sitka Pacific is an asset management firm whose goal is strong performance and low volatility, regardless of market direction.
Visit Sitka Pacific's Account Management Page to learn more about wealth management and capital preservation strategies of Sitka Pacific.
I do weekly podcasts every Thursday on HoweStreet and a brief 7 minute segment on Saturday on CKNW AM 980 in Vancouver.
When not writing about stocks or the economy I spends a great deal of time on photography and in the garden. I have over 80 magazine and book cover credits. Some of my Wisconsin and gardening images can be seen at MichaelShedlock.com .
© 2009 Mike Shedlock, All Rights Reserved
© 2005-2022 http://www.MarketOracle.co.uk - The Market Oracle is a FREE Daily Financial Markets Analysis & Forecasting online publication.