Are the Bailed Out Banks Speculating With Taxpayer Money?
Stock-Markets / Financial Markets 2009 Sep 11, 2009 - 05:29 PM GMT

 Under Quantitative Easing, the value of the Total Securities Held Outright on the Fed's Balance Sheet has increased by $917 billion- from $584 billion to $1.5 trillion. This has been accompanied by an almost linear increase in the S&P 500 Index, from 721 at QE announcement on March 18 to 1048 today.
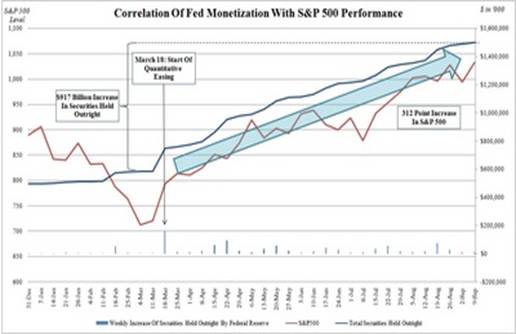 This $917 billion in extra liquidity, instead of igniting an inflationary spark, as the QE program was designed to do, is now (metaphorically) sloshing around bank basements. As a reminder: the most recent reading of Total Deposit Reserves was... $886 billion dollars: An almost dollar for dollar match with the increase in Securities Held Outright of $917 billion (by the Fed). Thanks, ZeroHedge.
Insiders selling like there’s no tomorrow.
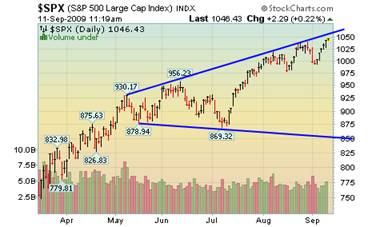 --The stock market has mounted an historic rally since it hit a low in March. The S&P 500 is up 55%, as U.S. job losses have slowed and credit markets have stabilized. But against that improving backdrop, one indicator has turned distinctly bearish: Corporate officers and directors have been selling shares at a pace last seen just before the onset of the subprime malaise two years ago. This week, the ratio of sellers to buyers was 95 to 1.
Investors show insatiable appetite for Treasuries.
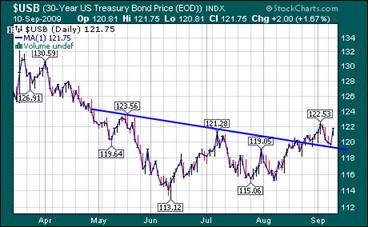 -- The U.S. Treasury Department’s auctions this week of $70 billion in notes and bonds shows the unprecedented amount of debt being sold to finance the record budget deficit is failing to curb investor demand. At yesterday’s $12 billion sale of 30-year bonds, investors bid for 2.92 times the amount of securities offered, the highest so-called bid-to-cover ratio for that maturity since November 2007, the Treasury said.
Gold is setting new highs.
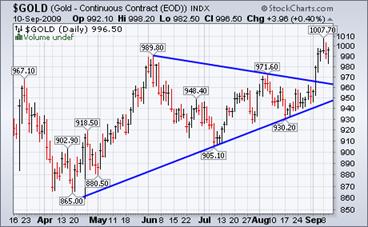 --Gold surged to the highest price since March 2008, heading for a fourth-straight weekly gain, as a dollar slump lengthened, boosting demand for the metal as a hedge against inflation. Earlier, the metal touched $1,013.70, the highest price for a most-active contract since March 17, 2008. On that date, gold reached a record $1,033.90 in New York.
Japan’s economy is growing less than anticipated.
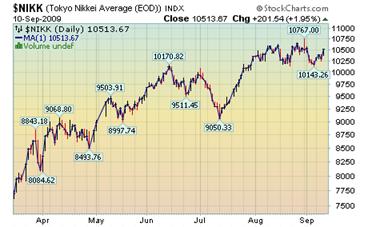 -- Japanese stocks declined, led by car manufacturers and steelmakers, after the nation’s economy grew less than estimated in the second quarter and the dollar weakened against the yen. The Nikkei 225 Stock Average lost 0.7 percent to close at 10,444.33 in Tokyo. The broader Topix index fell 0.8 percent to 950.41 after changing direction 13 times. This week, the Nikkei advanced 2.5 percent, and the Topix added 1.6 percent.
Will China avoid the bear market?
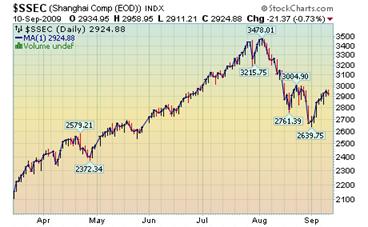
-- The Shanghai Composite Index rose to the highest in almost three weeks after industrial production and investment growth expanded, increasing optimism a rebound in the world’s third-largest economy will continue. The Shanghai index has rebounded 12 percent this month on signs the government will adopt measures to support equities after the index tumbled 22 percent in August on concern a plunge in lending would derail recovery.
Is it time to unwind the dollar carry trade?
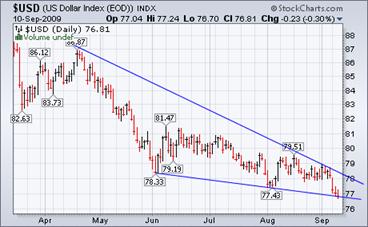 -- The Dollar Index fell for a sixth day, its longest losing streak since March, after reports showed China’s factory output and lending increased more than forecast, spurring demand for higher-yielding assets. “The data has been relatively good and the burden of proof in on the doomsayers,” said Paul Robson, a senior currency strategist in London at Royal Bank of Scotland Group Plc. “With policy makers saying they are going to keep monetary policy low and accommodative for some time, that’s supporting risk and people are using the dollar as a funding currency.” Time to unwind that bet?
The next leg down.
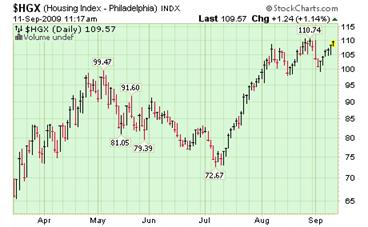 -- Loose lending standards in government-backed mortgages is setting up the next wave of defaults and sharp declines in housing prices. Beneath the hype that housing has bottomed is an ugly little scenario: lending standards are still loose and the low-down payment, high-risk loans being guaranteed by government agencies are setting up the next giant wave of defaults and foreclosures… the Feds have compensated for the implosion of the Fannie/Freddie housing-bubble machines by ramping up their other two mortgage mills: FHA and Ginnie Mae.
Gasoline has had 4 consecutive quarters of declining prices.
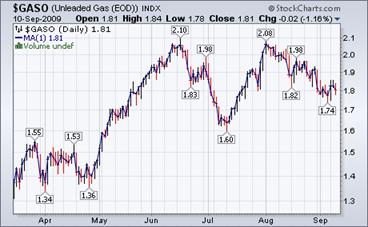 The Energy Information Administration Weekly Report suggests that, “With global oil consumption having decreased relative to year-earlier levels in every quarter since the middle of last year, we have now experienced four consecutive quarterly declines in world oil use, with another decline expected in the current quarter. This is an unusual situation, as declines in global oil consumption over that long a period have occurred only twice before over the past 50 years, in the mid-1970s and the early 1980s.”
Natural gas prices still modest.
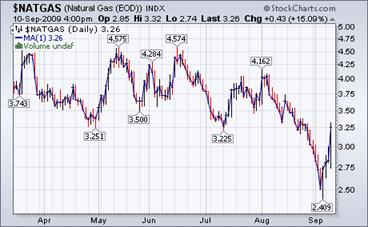 The Energy Information Agency’s Natural Gas Weekly Update reports, “Despite increases during the week, natural gas prices were very volatile, reaching lows not seen in seven years. Natural gas prices varied significantly during the report week, with prices at the Henry Hub in Erath, Louisiana, falling below $2 for the first time in more than 7 years and its lowest level in nearly 8 years. On September 4, heading into the Labor Day weekend, prices at the Henry Hub closed at $1.84 per MMBtu, the lowest level since December 6, 2001.”
Art Cashin on CNBC.
In an article on cnbc.com which covers Art Cashin's observations between the "eerie" similarities of the current market and the exponential ramp in the Spring and Summer of 1987 (and we all know how that ended), the video that accompanies it and is supposed to show Art Cashin's real time ruminations was replaced with an overlay of Rebecca Jarvis discussing market headlines. Obviously, this is merely a glaring technical glitch at the GE subsidiary.
The highlights from the article (which one hopes will not be pulled):
“I’m still somewhat skeptical about this [market],” said Cashin. “I’ve been wrong—got out too early. I took some money off the table a few weeks ago—didn’t take it all off.”
“There’s just some eerie things about this—it’s reminiscent of spring and summer of ‘87 when nobody believed the rally and it kept going up despite skepticism, people shorting into it,” he said. “It ate them alive until it suddenly turned.”
Always better to keep these things under wraps of course, and not provide some clip that could go viral in a matter of minutes. We hope CNBC promptly rectifies this error. (Source: www.zerohedge.com)
Our Investment Advisor Registration is on the Web
We are in the process of updating our website at www.thepracticalinvestor.com to have more information on our services. Log on and click on Advisor Registration to get more details.
If you are a client or wish to become one, please make an appointment to discuss our investment strategies by calling Connie or Tony at (517) 699-1554, ext 10 or 11. Or e-mail us at tpi@thepracticalinvestor.com .
Anthony M. Cherniawski,
President and CIO
http://www.thepracticalinvestor.com
As a State Registered Investment Advisor, The Practical Investor (TPI) manages private client investment portfolios using a proprietary investment strategy created by Chief Investment Officer Tony Cherniawski. Throughout 2000-01, when many investors felt the pain of double digit market losses, TPI successfully navigated the choppy investment waters, creating a profit for our private investment clients. With a focus on preserving assets and capitalizing on opportunities, TPI clients benefited greatly from the TPI strategies, allowing them to stay on track with their life goals
Disclaimer: The content in this article is written for educational and informational purposes only. There is no offer or recommendation to buy or sell any security and no information contained here should be interpreted or construed as investment advice. Do you own due diligence as the information in this article is the opinion of Anthony M. Cherniawski and subject to change without notice.
Anthony M. Cherniawski Archive |
© 2005-2022 http://www.MarketOracle.co.uk - The Market Oracle is a FREE Daily Financial Markets Analysis & Forecasting online publication.
Comments
|
Nadeem_Walayat
24 Sep 09, 21:42 |
UK Bailedout banks not lending
Britain's debt as a consequence of bailing out the banking sector continues to mushroom towards unprecedented levels as the amount the UK government borrowed for August 09 came in at an eye watering £16.1 billion, already at 65.3 billion for the first 5 months of the financial and heading for £185 billion for 2009 as the original analysis of November 2008 warned of (Bankrupt Britain Trending Towards Hyper-Inflation?). UK Public Sector Net Debt is on track to achieve the projected £185 billion for the calendar year 2009 or an eye watering 14.6% of GDP with little sign of any government attempt at closing the gap between revenue and spending this side of the General Election and therefore is in line with my analysis of May 2009 of the Labour delivering the next Conservative Government a Scorched Earth Economy. Bankrupt Banks Sparked Depression Bankrupting British Tax Payers The tax payer bailed out bankrupt banks have been busy rebuilding their balance sheets by over charging retail customers penalty interest rates as the gap widens between rates charged for mortgages of 4.5%+ against the base rate of 0.5% and the interbank rate of just 0.57% which gives the banks a huge profit margin and is a sign of the near total collapse of market competition between the banks which are getting fat on tax payer cash and returning to paying out obscene bonuses which is the reason why the Labour Government deserves to be thrown out of government at the next election for total disregard for the electorate. Meanwhile the tax payer liabilities continue to grow as I have warned several times over the past 12 months in that total liabilities are growing from £1.75 trillion at the end of 2007 to more than £3.9 trillion by the end of 2010 as a consequence of the £1.5 to 2 trillion of liabilities of the bankrupt banking sector being ceremoniously dumped onto the tax payers in addition to the public sector deficit spending of £600 billion over 3 years in the lead up to the next election on which the country will have to pay interest which worsens the fiscal situation during each subsequent year hence the risk of an out of control debt spiral and inflation.
Way back in April 2008 when the Bank of England first gave tax payer cash to the banks, I warned that this could eventually lead to a loss of as much as £200 billion to the tax payer, a huge sum of money by any measure, however now collectively Britain could stand to lose as much as £500 billion to the banks, that can only be covered by printing even more money to monetize the debt and hence leads to inflation and probable investors balking at government debt issuances. Therefore we are looking at £600 billion of deficit spending PLUS £500 billion of bankrupt bank losses leading to a near tripling of Britians debt towards 120% of GDP, whilst total liabilities project to more than 350% of GDP.
UK Debt Fueled Economic Bounce UK GDP contraction has hit the target low of -4.75% on an annualised basis in the second quarter which suggests continuing recovery in Q3 and Q4 that signals that the UK economy remains on track to be out of recession by the start of 2010 with probability favouring Q3 being positive at +0.3% and Q4 in the region of of +.6 as per the analysis of June 2009 (UK Economy Set for Debt Fuelled Economic Recovery Into 2010 General Election) which is marginally ahead of the original forecast of February 2009, and compares against the OECD which appears to be way off the mark- Britain will be the only major economy not to return to growth by the end of the year, the Organisation for Economic Co-operation and Development (OECD) said yesterday as it downgraded its 2009 forecast for the UK He said the OECD was actually slightly less gloomy about the UK than it was in June, when it expected the UK economy to contract by about 0.4pc in the third quarter of this year. It now expects a smaller fall of 0.25pc. It was predicting a fall of about -0.1pc in the final quarter of the year, it now predicts flat growth. Whilst the OECD and other mainstream organisations / press have been busy in recent months revising their economic forecasts, my forecast remains the same as per Feb 09 and continues to project towards post general election tax hikes and deep public spending cuts that will in my opinion trigger a double dip RECESSION, even DEPRESSION 2011 to 2012 as illustrated by the graph.
To find out what I expect to transpire over the NEXT 10 years subscribe to my always free newsletter to receive this in your email box. By Nadeem Walayat http://www.marketoracle.co.uk Copyright © 2005-09 Marketoracle.co.uk (Market Oracle Ltd). All rights reserved. Nadeem Walayat has over 20 years experience of trading derivatives, portfolio management and analysing the financial markets, including one of few who both anticipated and Beat the 1987 Crash. Nadeem's forward looking analysis specialises on the housing market and interest rates. Nadeem is the Editor of The Market Oracle, a FREE Daily Financial Markets Analysis & Forecasting online publication. We present in-depth analysis from over 400 experienced analysts on a range of views of the probable direction of the financial markets. Thus enabling our readers to arrive at an informed opinion on future market direction. http://www.marketoracle.co.uk Disclaimer: The above is a matter of opinion provided for general information purposes only and is not intended as investment advice. Information and analysis above are derived from sources and utilising methods believed to be reliable, but we cannot accept responsibility for any trading losses you may incur as a result of this analysis. Individuals should consult with their personal financial advisors before engaging in any trading activities.
|