


Gold Breaks Out Triggers Multiple Time Frame Buy Signals
Commodities / Gold & Silver 2009 Sep 13, 2009 - 06:15 PM GMTBy: Chris_Vermeulen

 Gold is back in the spot light as it flirts with the $1000 per ounce level. This closely watched commodity looks as thought it will rocket higher because of the multiple trading time frames indicating breakouts.
I mainly focus is on trading the daily chart but I always refer back to the longer time frames which are the weekly and monthly charts. Knowing the momentum and trend on these long term trading charts allow me to identify the strength of the rallies and sell offs on the daily chart. I use this analysis for determining how large of a position to take, and where to place profit targets and stop loss levels.
Trading gold stocks does provide explosive opportunities when the price of gold moves. The past couple years I have only been focusing on trading gold to the long side because the overall long term trend is up. Trading with the longer term trend always improves the odds of winning the trade. I will short GLD or GDX funds for an intraday trade using my simple Kitco gold overlay Day Trading Strategy. I have posted this strategy a couple of times on the internet, if you want to read more about it.
Below is my analysis explaining the price action of gold stocks on the daily, weekly and monthly charts. I also a listed the US and Canadian funds which I trade.
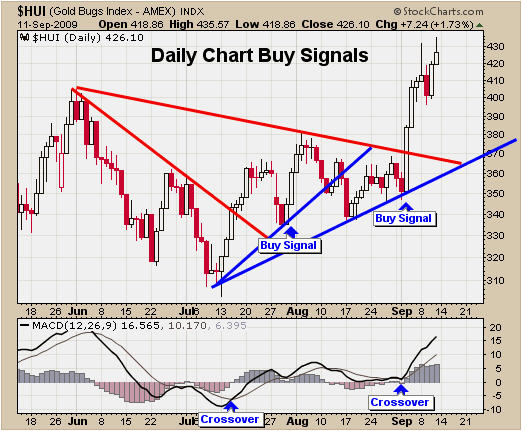
HUI Gold Stocks Index – Daily Chart – Short Term
The daily chart of the HUI clearly shows buy and sell signals, which were generated in the past 2 months. Using resistance trend lines for breakout levels is very important. I also use pivot lows to draw and connect my support trend lines, which allow me to calculate down side risk and buy signals. The recent breakout is very strong and that is because the weekly and monthly charts are showing a breakout to the upside triggering longer term traders/investors to buy.
Daily chart buy and sell signals are for short term trades which last between 2-20 trading days. My focus is to lock in 1-5% gains but in a strong trend I can pocket 10-20% return in a short period of time.
Gold Stocks Newsletter
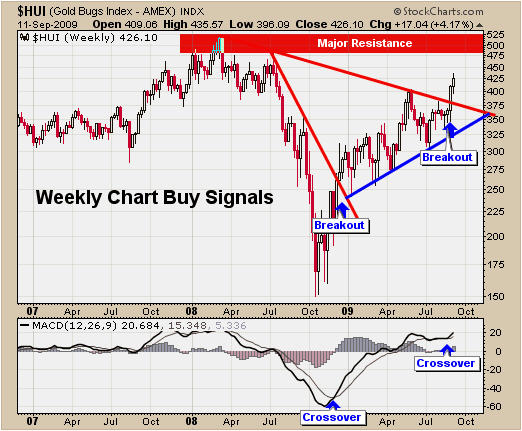
HUI Gold Stocks Index – Weekly Chart – Intermediate Term
Weekly chart patterns and breakouts provide a much larger move in general so watching this chart is crucial for long term success. Following the weekly chart goes for trading every investment vehicle whether you are trading stocks, futures, FOREX etc…
This chart generated a buy signal in December of 2008, which we took advantage of. And just 2 weeks ago it gave us another buy signal. Again using my simple trading strategy which involves trend lines and the MACD momentum indicator, we are able to establish clear buy and sell signals.
Gold Stocks Trading
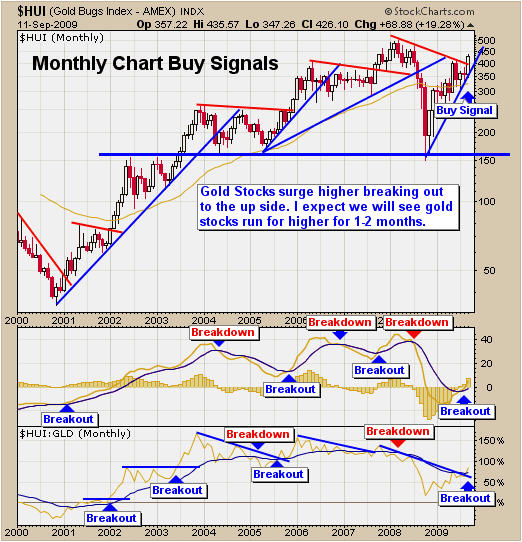
HUI Gold Stocks Index – Monthly Chart – Long Term
Long term investors will use the monthly chart for timing their buy and sell signals because once the momentum has shifted direction it tends to last for several months if not years. I do not focus on trading these long term signals but I use them to help me know the momentum (power) of the next possible breakout. This also helps me in deciding whether to scale out on rallies with some of my position locking in some profit and buying back on dips, while leaving a core position incase the price continues to rally.
The monthly chart of the HUI shows a breakout this month and if the price can hold until Oct we will have a complete long term buy signal. I use the MACD for momentum and the HUI:GLD ratio to confirm the breakout which puts the odds more in my favor.
Gold Stocks Newsletter
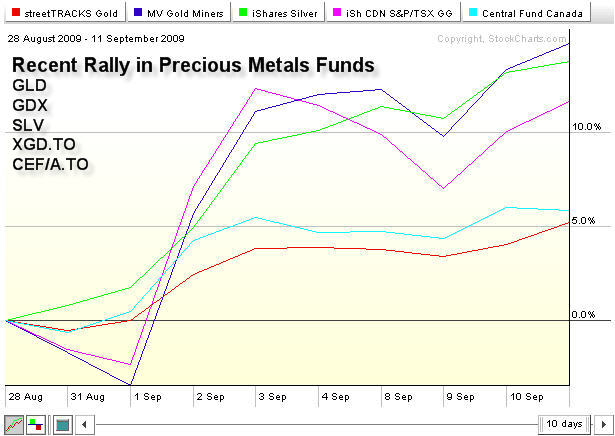
Precious Metals Funds for Trading Gold and Silver Moves – Daily Chart
Here is a list of the precious metals funds I trade on a regular basis. I trade both US and Canadian funds. Because I am based in Canada I focus on Canadian gold stocks and gold funds when there are intermediate/long term signals which I trade in my retirement account.
The funds I trade are GLD (gold bullion), GDX (gold miner stocks), SLV (Silver Bullion), XGD.TO (Canadian Gold Stocks), CEF/A.TO (Canadian Gold & Silver Bullion). If you look at a comparison chart you will see some funds provide much larger moves than others. In general I like to own a bullion fund and a precious metal stock fund so that I get the best of both worlds.
Gold Trading Investments GLD, SLV, HUI, GDX
My Gold Stocks Newsletter Trading Conclusion:
In short, Gold and gold stocks are on fire. The next 13 trading days are very important for gold as it battles to breakout above the $1000 – $1033 level which is the 2008 high. With gold trading at this MAJOR resistance level also known as a “Pivot Point”, the risk level is higher for traders. The odds are pointing to higher prices but we must recognize that price action becomes volatile and fast moving. We could see the price breakout and rally to the $1500 level within months which is what are currently positioned for. But we must realize that gold could create a double top and sell off very quickly which is why we have stops in place to protect us.
So those of you who are long be sure to lock in some profit and be ready for some wild price action in the coming weeks.
If you would like to receive my free weekly trading reports visit this webpage to join my newsletter: www.GoldAndOilGuy.com
Hello, I'm Chris Vermeulen founder of TheGoldAndOilGuy and NOW is YOUR Opportunity to start trading GOLD, SILVER & OIL for BIG PROFITS. Let me help you get started.
If you would like more information on my trading model or to receive my Free Weekly Trading Reports - Click Here
If you have any questions please feel free to send me an email. My passion is to help others and for us all to make money together with little down side risk.
To Your Financial Success,
By Chris Vermeulen
Chris@TheGoldAndOilGuy.com
Please visit my website for more information. http://www.TheGoldAndOilGuy.com
Chris Vermeulen is Founder of the popular trading site TheGoldAndOilGuy.com. There he shares his highly successful, low-risk trading method. For 6 years Chris has been a leader in teaching others to skillfully trade in gold, oil, and silver in both bull and bear markets. Subscribers to his service depend on Chris' uniquely consistent investment opportunities that carry exceptionally low risk and high return.
This article is intended solely for information purposes. The opinions are those of the author only. Please conduct further research and consult your financial advisor before making any investment/trading decision. No responsibility can be accepted for losses that may result as a consequence of trading on the basis of this analysis.
Chris Vermeulen Archive |
© 2005-2022 http://www.MarketOracle.co.uk - The Market Oracle is a FREE Daily Financial Markets Analysis & Forecasting online publication.