


Stocks & Commodity Markets Technical Analysis: Too Many Were Trading the 4th Wave
Stock-Markets / Financial Markets Jun 24, 2007 - 11:45 PM GMTBy: Dominick
 After calling the market perfectly from the June 2006 low all the way to the June 1 st 2007 turn, right down to the exact date, I could just step back and say the top is in and that I told you first. Unfortunately, I have too much reason to believe the ingredients for a perfect top are not yet in the mix but still out in front of us to simply ignore it and walk away. As of this weekend the confirmation needed isn't there. If it appears early next week I will be fast to work on bearish patterns, but not until then.
Next week the markets could go down big and some would say I blew the call. Fair enough, I'm not writing a book or trying to become famous. I'm only trying to run my site as I want and teach traders things they never thought were possible. Maybe that's why my forum continues to grow rapidly, and why many members are making serious profits, or at least curbed the old bad habits that were really costing them.
As they know, a big part of improving your trading is asking yourself whether you're a trader, investor, or speculator. Maybe you just click “buy” and pray. The point is that your timeframe will have a big effect on the way you interpret a chart.
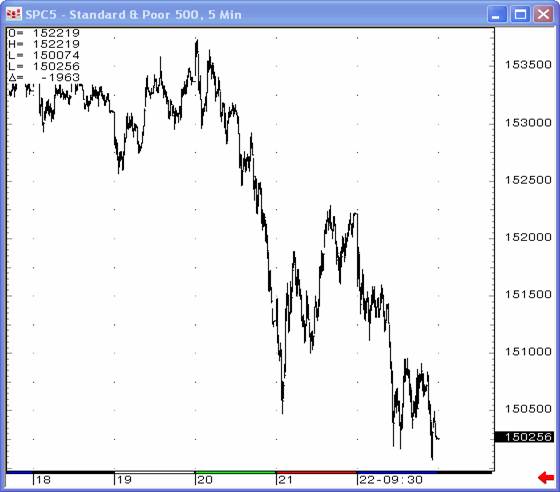
The chart above is what's fresh in our minds after a week's work. We clearly all came away Friday feeling the selloff in every cell of our bodies and, from this perspective, some are quick to say a major top is in. It totally amazes me that, in the internet world we live in, the majority of traders have no idea what the longer term chart of this market looks like.
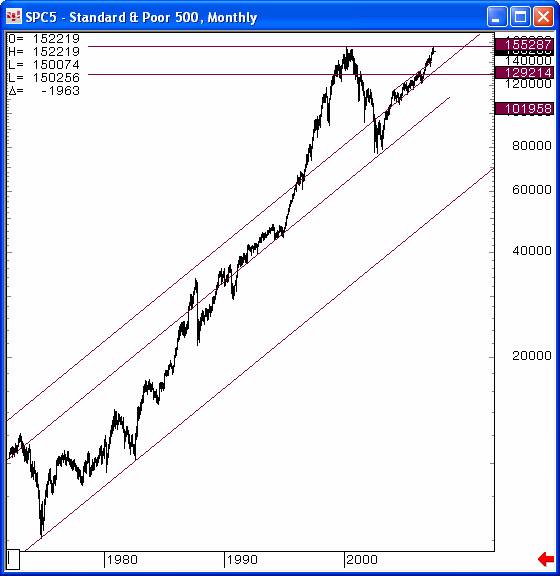
Look at it that way, and it becomes obvious that too many traders and investors are caught up in a 5-min chart, or maybe a daily, and don't realize where the markets have been and could still be going. Clearly this isn't 1974 anymore, and a 15-20 point selloff isn't a crash, just an everyday part of business. I did express for the first time a few weeks ago that we would be approaching a major turning point, and we also had the turn I predicted for June 1 st . But after eighteen months of seeing me confront the challenges, members know that their best interest is factored into my analysis every single day and if there is too much evidence in my work to write off the S&P and say the top is in, then they know I just can't do it.
But more on that later. First let's take a look at how we traded the week that just ended. Though we usually focus on the major stock market indices, the last five trading days really gave us a chance to showcase other areas of the site for our newer members. The last update warned that we were in for a sleepy fourth wave consolidation and suggested, “Sometimes the best thing to do is to find a different market to trade or scalp away.” When this is exactly what the market delivered on Monday, our traders began scalping better setups – in wheat, oil, sugar, bonds, beans – essentially using TTC exactly the way it was intended. Be sure to see an amazing OJ trade below along with a funny link from “Trading Places”
Tuesday and Wednesday turned out to highlight another important aspect our unbiased technique: knowing when a count is wrong! I've been saying for months now that it's more important to know the next trade than it is to know the specific count, and this is a big part of what allows us to stay so flexible. Going into Tuesday it looked like wave 4 could be finishing up, but it could also have been a triangle, or a double three, or something else entirely. This is the chart we used going into that morning's open:
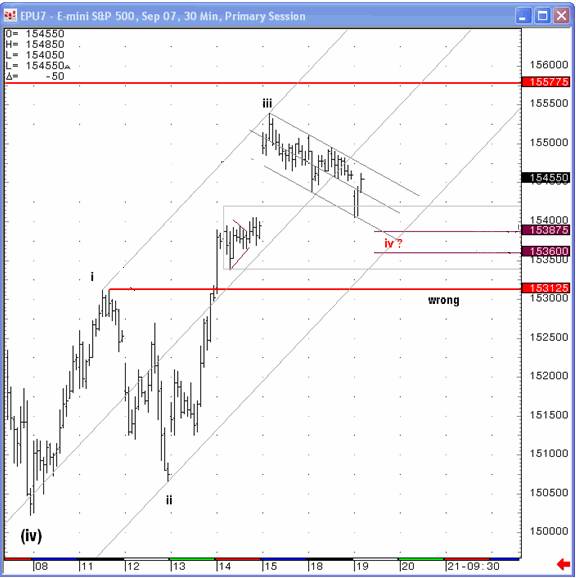
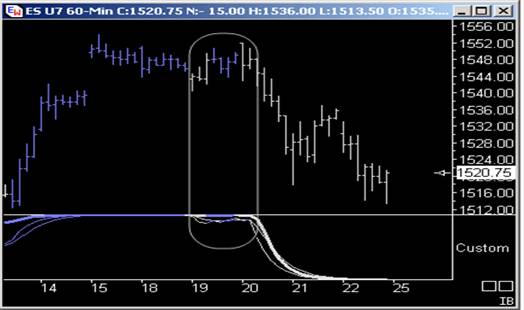
At 1548, the long off the bottom became a tired trade and TMAR (take the money and run) took effect as we peeled off the longs, netting 4 points. After Tuesday's close I believed we had a trap setting us up, a bull trap for a change. We had just traded into that top perfectly and had a legit count that would take us to my SPX 1552 target but it didn't feel right. At this juncture it appeared that we might have had wave 1 of 5 and were prepared for a second wave retrace. But we were also wary of the possibility that wave 4 was only half complete. Given the lack of a change in sentiment, and that another Fed meeting looming the next week, it was definitely possible to see the 4 th wave continue into a larger complex correction. It also had the feel that everyone was trading the same count, something we usually don't do. The bottom line was that too many were trading the 4 th wave. That night and Wednesday morning I expressed my concern even though globex had gapped higher.
Within 15 minutes of the open the S&P put in its top for the week and has not traded there since. We did try to find a lower level of support to turn from, missing staying short the whole 20+ point selloff this week, but we made much more than that trading the ups and downs. More importantly, we were able to sniff out that trap at the top in realtime and short it instead of getting long! Each day I receive requests from non members asking if TTC could send out daily email updates and I haven't entertained that idea because of how this week proved again the need for realtime analysis.
The chart below shows how we traded the week. If we need to get short 10 points lower because of needed confirmation next week, we will do better than the trader that shorted the exact high. If we find another reversal, it could be one that short traders won't want to remember. We've done this hundreds of times and will continue to do so because markets don't travel in a straight line and only really crash maybe once in a lifetime.
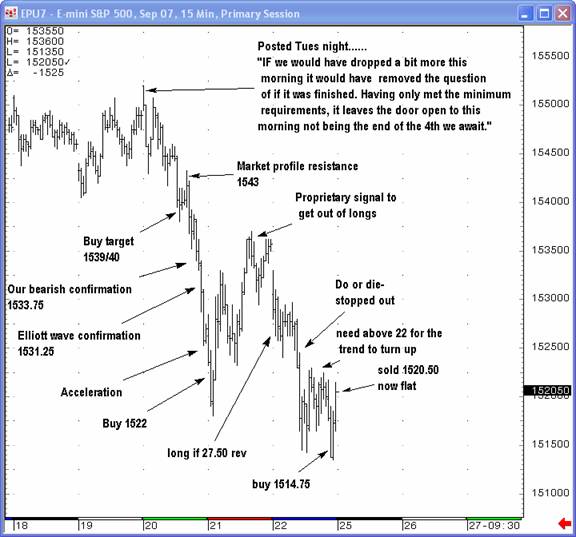
Notice in the chart above that the whole time we had both a target area, but also a line in the sand where we would accept we were wrong. Importantly, none of these are arbitrary numbers, but strictly based on Elliott rules that would invalid the count. This is the heart of unbiased trading! Once price overlapped what we'd been counting as wave 1, our working count was invalidated and we immediately reverted to an alternative we'd been considering for some time but not favoring.
Of course the selling continued from there and we thought we could target 1539 in the S&P Futures from this week's pullback, but it didn't hold. We did trade short into it and, after it took out our support of 1533.75, we turned bearish against the short term move. Once the 1531.25 area that the whole world seemed to be watching finally gave out, the move accelerated down.
But, being the “unbiased traders we are, the broken up pattern that everyone now saw didn't stop us from trying to buy 1522. We did, in fact, and watched the Futures rally to 1537 on Thursday's close as a proprietary sell signal was triggered at the high. As you can see, we don't miss a thing dancing around the market and forcing it to give us the confirmation we need.
It felt odd, waking up down seven points in the Futures on Friday morning, but the market had been thrown a lot of bad news and it didn't get any better throughout the day. This week it had to absorb higher interests rates, hedge fund blowups, a failed Elliot wave pattern, all on top of the typical selling of a summer Friday. It actually didn't do too bad, when you step back and look at it.
To sum things up, as I've said before, m arkets can turn on a dime and I can't promise you right now anything more or less than that if there's confirmation of a top next week, then I'll see it. In the meantime, I'll be looking for an aggressive long in the early part of the week with a close line in the sand to indicate if I'm wrong. Of course, those levels are reserved for our members.
Remember last week we showed you how to make a five point risk become a 50 to 100 point gain. That trade made 47 points. This is the same kind of situation I think we have developing here, and not only will we be able to get out of the way quick, but I'll be working overtime to see if it really is time to finally turn bearish on this market. Until then, this market will continue to do what it's done for years, create a bear trap as it retests support.
Big pit traders might have already sensed the same setup at the same time I went long in my chatroom into the last minutes of the day. I bought 1514.75 and was able to see it rise within 15 minutes to 1521.50. I did sell it back them into the 4:15 close to keep an unbiased view over the weekend, but it emphasizes again some of the intangible benefits of membership -- it's more important to know the next trade than the exact count. In this case, stocks were clearly leaning too much to the short side and had to spring back. Will this continue next week? We'll have to wait and see, but as always, if not, we'll know quickly and be able to trade anything we're given. More important is the fact that this weeks trading has started to act like the 90's where there are ten times as many points to be made trading versus counting, and we're are ready to trade this trader's paradise. Be EXTRA careful this week as the game is changing a bit.
As I hinted at earlier, the beauty of covering so many markets with our technical analysis is that we're freed up to play our game in markets where the setups are clear, rather than trying to guess at a setup that doesn't yet exist or sitting on evaporating option premium or trading out of boredom. The way the early part of this past week played out, not only were our members able to avoid losing premium on options positions, they made good money in other markets while the S&P moved sideways, still deciding on its next move. Because if we did have a bias, it would be towards making the most amount of money with the minimum risk.
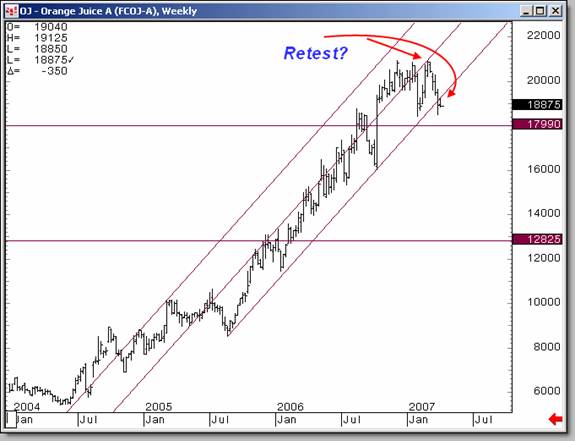
For example, on April 7 th I posted this OJ chart showing that we had seen the needed confirmation to our expected top. Along with the topping idea I had already placed two lines of vibration to help me understand the decline that was coming. With the price levels OJ had reached to that point, I'm sure members thought I was maybe a little overworked if I was expecting to see any price vibration to the lower target.
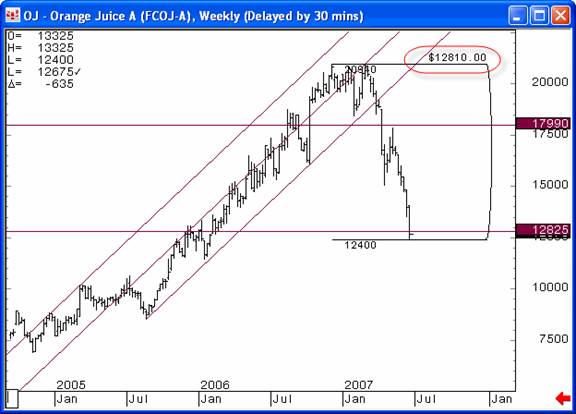
Well, the chart below shows that on Friday we did reach exactly those levels. Click the link for a scene from the movie “ Trading places ” when the same OJ scenario was happening. Go on, it's funny, and might leave you something to think about as you trade all the markets with your hard earned money. Also, please don't assume anything about OJ going forward. I'll keep members updated about this area and whether it's a buy or if there'll be a continuation of the selloff. It seems as it technically needs some work down here before any advance can happen. Bottom line is members had access to a $12,800 profit in two months, PER contract.
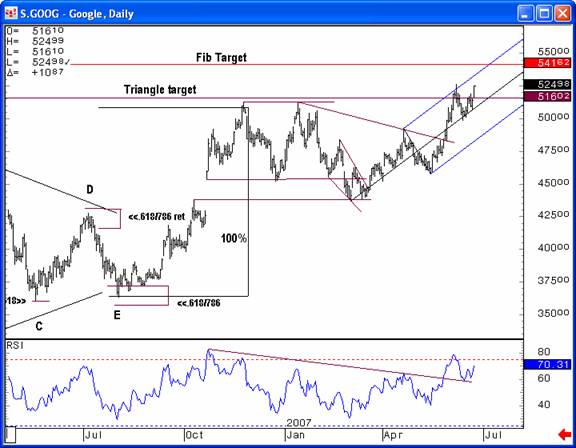
Up eleven as the market is about to fall apart – is GOOG trying to reach its target before things get ugly, or does it know that the a low in the S&P's is near? Either way, what a winner! Last year we had a $125 gain from a low risk trade. Then it went to a perfect Elliott target leaving my Fibonacci target behind. I never gave up on that target, though, and continued to post that I was excited to see if it would eventually find its way to where I believe it must go. After the Elliott target was hit there was no reason or pattern to see prices back up here just sixteen points shy of that target. This could be evidence to validate the theory that we're counting the waves left behind by Fibonacci. Stay tuned!
Gold
It's been the sideways, rangebound trading we've expected in gold, which took a step above the 5-day moving average this week, but gave it up after a string of bad news took the air out of markets across the board. Still, metals have yet to even significantly retest serious support levels since recovering from the selloff in January, and are up for the year even if it doesn't feel like it. With inflation apparently cooling and an important Fed meeting coming up next week, be sure to read Joe's Precious Points update for the implications on gold and silver.
Proprietary Trend charts
My Trend charts continue to not only confirm each week's moves, but lead the way. Come and experience the truth behind the saying, “the trend is your friend”.
Members
Be sure to visit the Weekly Maps. As many of you know, the Weekly Maps section of the site is where I lay out the big picture ideas for the following week along with charts from any other markets that seem to be playing a part in what we trade. And TRUST ME, next week is important!
Also make sure you are aware of TTC's new addition to help many keep an eye on the Forum updates without needing to constantly login to check. We made this neat feature that you open to your desktop and you will be able to see when someone posts, and who is posting. There are some handy links there as well as a small time frame trend chart. I'm sure I'll find other things to add to it.
Non Members
LAST week of the original fee.
We work hard for our continuously profitable setups and they've been more than proven in the seemingly unbelievable results published in this free update for well over a year. At $50/month the current price of joining our trader's paradise is really not an issue, especially considering this discount price is only available for 1 more week! I have mentioned the increase for months and starting July 1 st it will be $89 a month . Current members and anyone that joins before the increase takes effect will not be subject to the new price, and will continue paying the current $50 subscription fee on a month-to-month basis. So, if you have been thinking of joining, this is a great time.
Plus, since the refundable fee works out so well I will have it available this week so that anyone thinking about joining will then also be joining under the grandfathered rate of $50 Join before June 29, 2007 and if you don't like it after a full week's try, send me an email asking for a refund, No questions asked.
Have a profitable and safe week trading, and remember:
“Unbiased Elliott Wave works!”
By Dominick
For real-time analysis, become a member for only $50
If you've enjoyed this article, signup for Market Updates , our monthly newsletter, and, for more immediate analysis and market reaction, view my work and the charts exchanged between our seasoned traders in TradingtheCharts forum . Continued success has inspired expansion of the “open access to non subscribers” forums, and our Market Advisory members and I have agreed to post our work in these forums periodically. Explore services from Wall Street's best, including Jim Curry, Tim Ords, Glen Neely, Richard Rhodes, Andre Gratian, Bob Carver, Eric Hadik, Chartsedge, Elliott today, Stock Barometer, Harry Boxer, Mike Paulenoff and others. Try them all, subscribe to the ones that suit your style, and accelerate your trading profits! These forums are on the top of the homepage at Trading the Charts. Market analysts are always welcome to contribute to the Forum or newsletter. Email me @ Dominick@tradingthecharts.com if you have any interest.
This update is provided as general information and is not an investment recommendation. TTC accepts no liability whatsoever for any losses resulting from action taken based on the contents of its charts, commentaries, or price data. Securities and commodities markets involve inherent risk and not all positions are suitable for each individual. Check with your licensed financial advisor or broker prior to taking any action.
Dominick Archive |
© 2005-2022 http://www.MarketOracle.co.uk - The Market Oracle is a FREE Daily Financial Markets Analysis & Forecasting online publication.