


U.S. Dollar Positive Divergence on the Weekly Chart
Currencies / Forex Trading Sep 30, 2009 - 09:27 AM GMTBy: Guy_Lerner

There is a strong trend. Negative divergences in an up trend or positive divergences in a down trend (between price and momentum oscillators that measure price) begin to show up on the weekly charts. Traders position themselves for a trend reversal as the divergences are indicative of slowing momentum. The reversal never comes, and the trend continues in the same direction often times accelerating as traders bail out of losing positions.
Sounds familiar? We have seen this in equities this year as prices bolted higher in mid July, and we have seen this in the Dollar Index as a continuation of the down trend that started in April. This is the "this time is different" scenario.
So what is the big deal? Well our key asset, the Dollar Index, is forming a positive divergence on the weekly charts. See figure 1, a weekly chart of the Dollar Index.
Figure 1. Dollar Index/ weekly
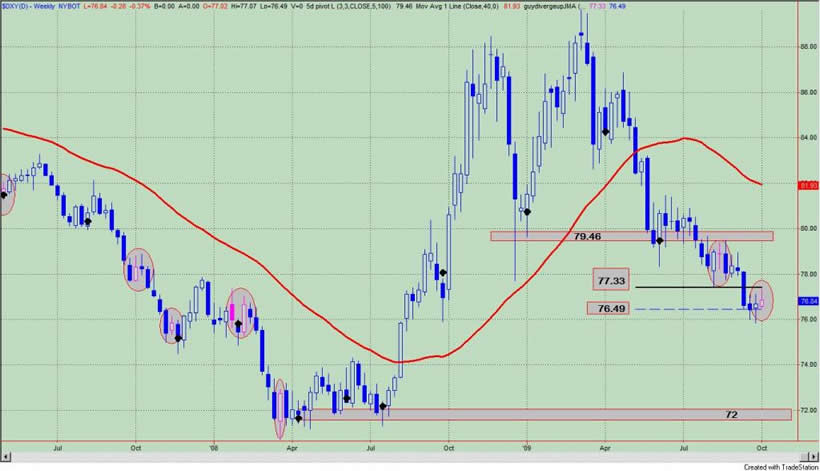
Positive divergence bars between a momentum oscillator that measures prices and price itself are highlighted by the pink prices within the gray oval. As can be seen, closes above these price bars led to an intermediate trend reversal or a close below the lows of these positive divergence bars resulted in an acceleration of the trend lower.
So with the positive divergence in place on the weekly, a close above the highs (77.33) of this price bar would result in the down trend being stymied. A close below the lows (76.49) of this positive divergence bar would likely result in an acceleration of the downtrend as traders cover their losing positions. (Anecdotally, much of my email recently has suggested that many traders are positioned for a reversal in the Dollar Index, so we shall see if "this time is different".) In any case, this acceleration of prices could come to fruition as there is very little support between current prices and the lows seen in April, 2008.
Lastly, a weekly close above the pivot low point at 79.46 would likely result in a new up trend.
And one final note: The Dollar Index -that same key asset to follow - that has been driving returns in both equities and commodities is down today. Surprisingly, equities are down too. Commodities will remain the beneficiary of a falling Dollar. Equities should start to struggle in such an environment as inflationary concerns (real or perceived mount) and the notion that no country has ever devalued its way to prosperity takes hold.
By Guy Lerner
http://thetechnicaltakedotcom.blogspot.com/
Guy M. Lerner, MD is the founder of ARL Advisers, LLC and managing partner of ARL Investment Partners, L.P. Dr. Lerner utilizes a research driven approach to determine those factors which lead to sustainable moves in the markets. He has developed many proprietary tools and trading models in his quest to outperform. Over the past four years, Lerner has shared his innovative approach with the readers of RealMoney.com and TheStreet.com as a featured columnist. He has been a regular guest on the Money Man Radio Show, DEX-TV, routinely published in the some of the most widely-read financial publications and has been a marquee speaker at financial seminars around the world.
© 2009 Copyright Guy Lerner - All Rights Reserved
Disclaimer: The above is a matter of opinion provided for general information purposes only and is not intended as investment advice. Information and analysis above are derived from sources and utilising methods believed to be reliable, but we cannot accept responsibility for any losses you may incur as a result of this analysis. Individuals should consult with their personal financial advisors.
Guy Lerner Archive |
© 2005-2022 http://www.MarketOracle.co.uk - The Market Oracle is a FREE Daily Financial Markets Analysis & Forecasting online publication.