


Probable Price Ranges for SPY, FXI, UUP and TLT
Stock-Markets / Forecasts & Technical Analysis Oct 08, 2009 - 04:27 PM GMTBy: Richard_Shaw

 There is no way to realistically make a precise price prediction for a particular date for a traded security. It is possible, however, to observe the recent historical volatility (standard deviation) of a security to make realistic estimates of the probable range within which the security price may close through a future date.
In this article, we provide short-term probable price range estimates for large-cap US stocks (SPY), China stocks (FXI), the US Dollar (UUP) and US long-term Treasuries (TLT).
Understanding and Managing Risk:
Gauging probabilities for uncertain future prices of highly variable securities is the kind of thing that options traders do all the time. It is also something that stock and bond investors can do as part of their effort to understand and manage risks.
Of course, there are the exceptional shock events such as the world experienced in 2008 that fall well outside of normal probability ranges. In a negative situation like that, protective stops or other active steps are necessary to just get out of the way.
Price changes could be flat, upward moving, or downward moving over any projection period, but the probability ranges derived with standard deviation data and a normal distribution curve assumption can bracket the range within which prices are likely to close.
The boundaries of those ranges can be useful in selecting stop loss trigger points or in selecting option strike prices, and generally to appreciate the level of risk or opportunity that may be present in the short-term for each security.
You need to apply additional fundamental or technical information and judgment to decide the direction of price movement. Probability ranges simply help you understand the probable limits to price movement for a security over the selected number of forward market days, but do not suggest direction.
Statistical Tools:
While securities do not exhibit a perfect “normal” bell-shaped distribution of percentage price changes, most (but not all) of the time the pattern is reasonably close for general bracketing of probable price changes.
The pattern of likely future prices expands as the future date moves farther away form the current date. In a “normal” distribution, the shape of the range of probable prices is conical (it expands with the square root of the time distance form the starting date). Some people call those ranges “probability cones”.
If the price change distribution is approximately “normal” (a working assumption) and if you know the historical standard deviation of the percentage price changes, then you can make estimates of the range within which future prices will probably close. You can do the same thing with implied future volatility in options, but not all securities have active options, making historical volatility more universally available.
The argument against historical volatility is expressed in the SEC’s obligatory caution to be made by advisors; “past performance is no guarantee of future performance”. That said, the past is not irrelevant. Back testing of probability cones using short to intermediate history shows them to be fairly good at bracketing short-term future price action — not perfect, but pretty good.
We like to look at 1-month and 3-month future periods, based on 1 and 2 standard deviations derived from several historical periods (252-days, 126-days, 63-days, and 21-days). This post presents 1-month forward cones for those standard deviations derived from those historical periods.
One more time, remember that price range probability cones do not predict where within those ranges, either up or down, prices will close — just the range within which closing prices are likely to occur at selected levels of probability based on known historical volatility. Less probable prices can and sometimes do occur outside of the probability cones .
Available Software Tool:
Metastock software has a built in function that calculates and plots the “probability cones” for any level of probability for any future period based on any past period of observations. The charts in this post were developed with Metastock.
Price Range Probability Cones:
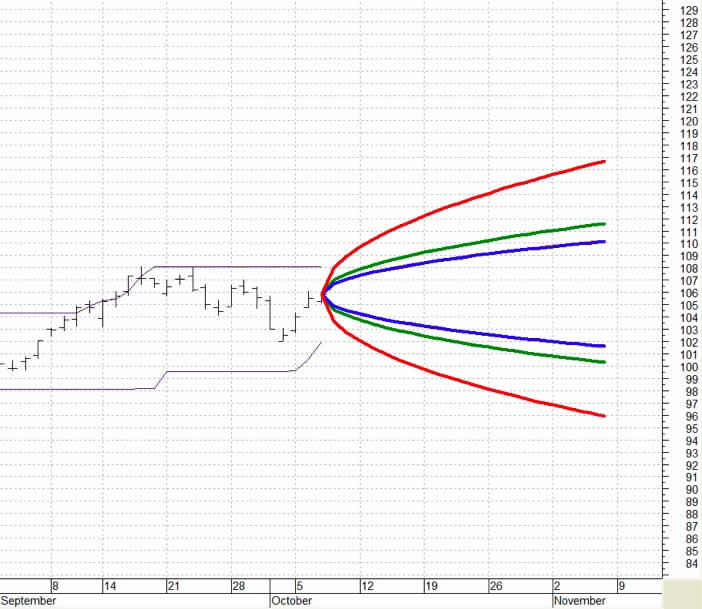
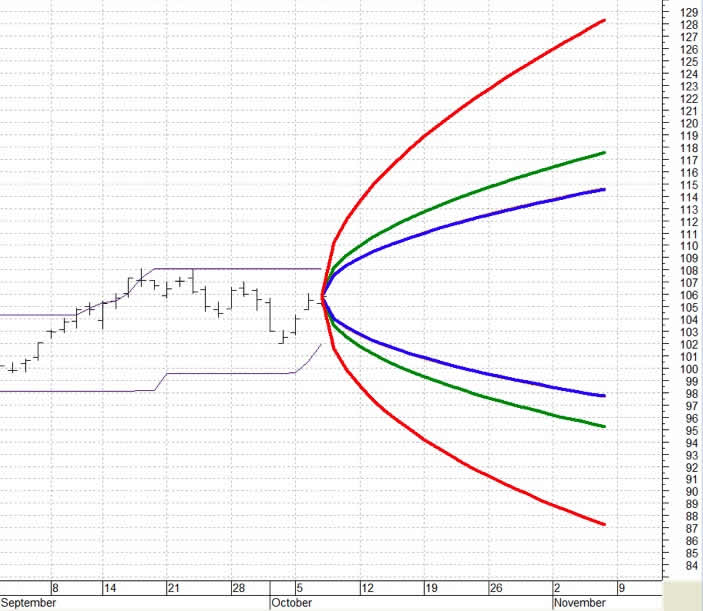
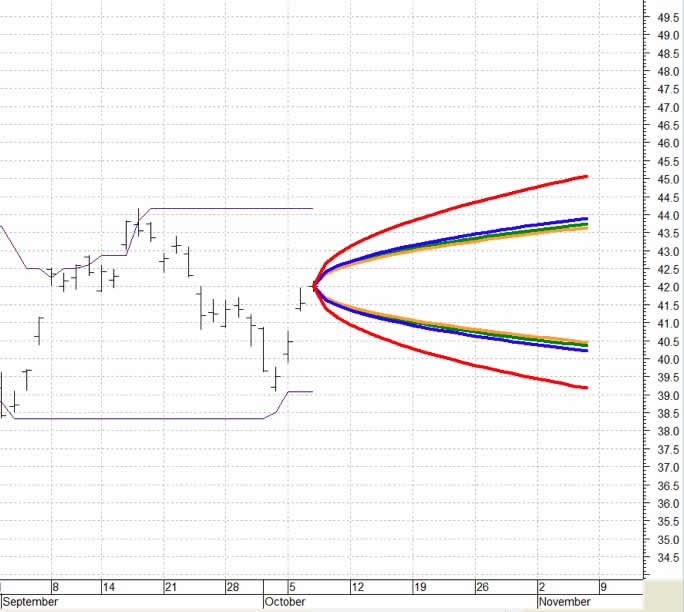
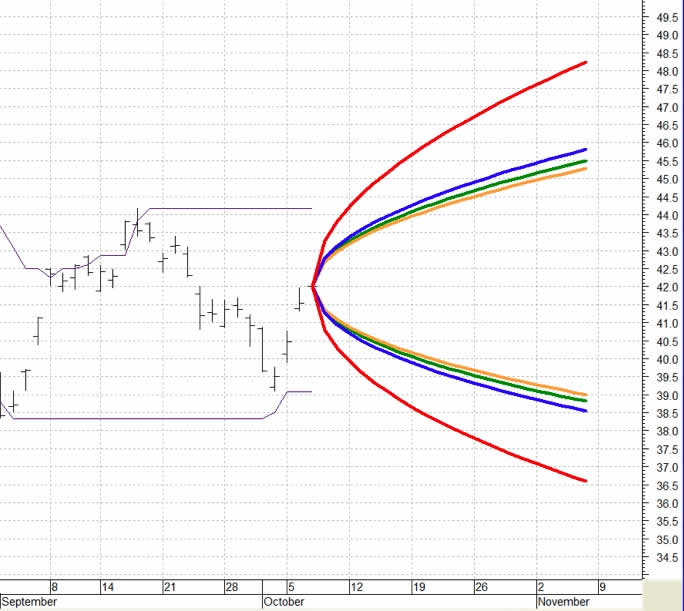
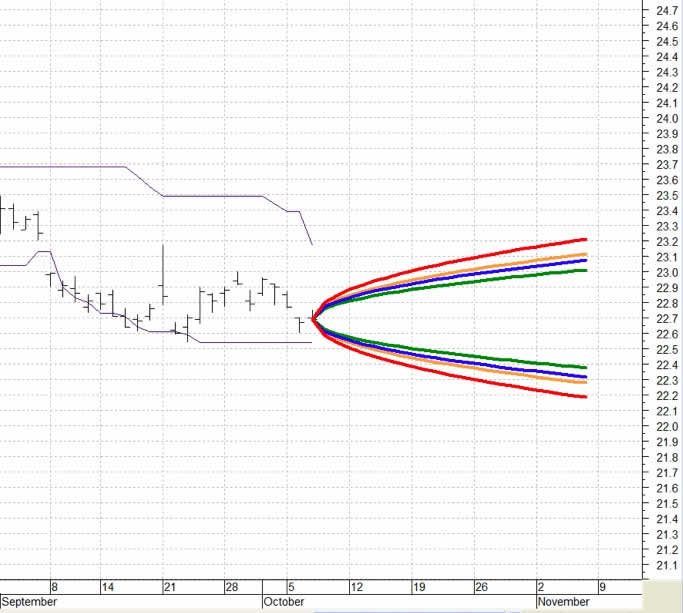
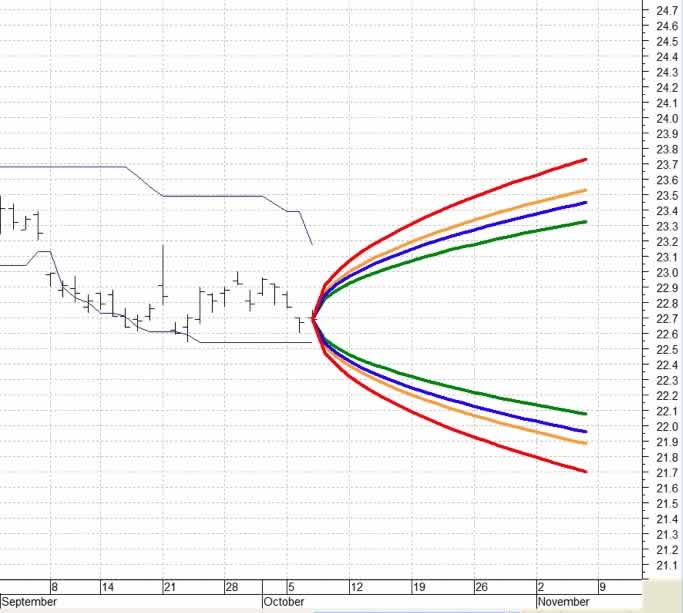
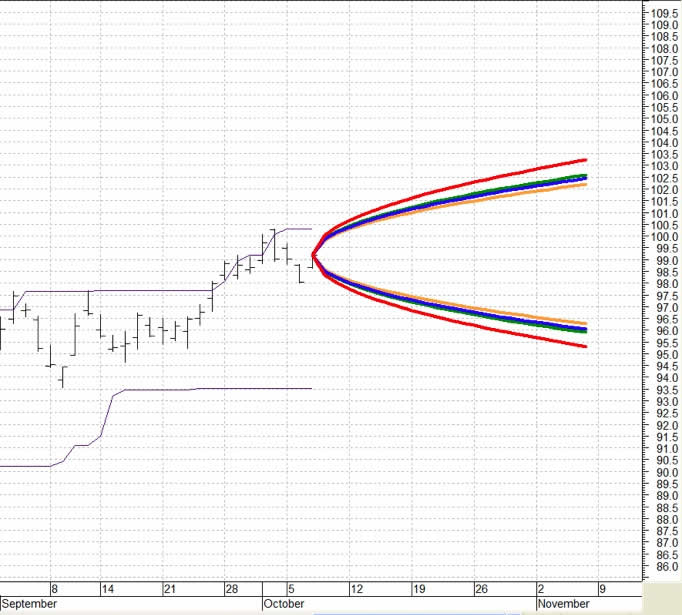
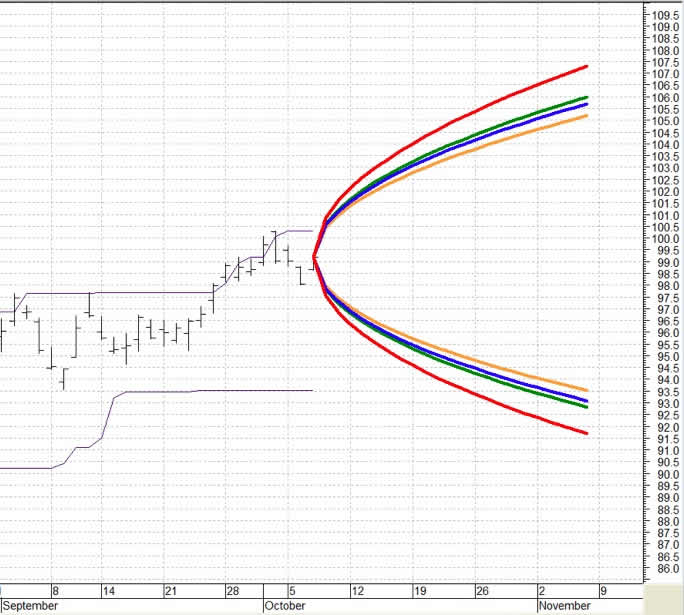
Here, we look at probable price ranges from October 7 through November 6, 2009 based on 68% probability (1 standard deviation) or 95% probability (2 standard deviations) for SPY, FXI, UUP and TLT.
For each chart, there are probability cones for four different historical periods of price variation. The red cones are based on the last 252 closing prices (1 year). The green cones are based on the last 126 closing prices (6 months). The blue cones are based on the last 63 closing prices (3 months). The gold cones are based on the last 21 closing prices (1 month). The thin purple lines are the 21-day high-low price channel for reference.
In some instances the 63-day and 21-day cones are so close that the gold is covered by the blue and cannot be seen. It’s still there, just behind the blue.
SPY 68% Probability
SPY 95% Probability
FXI 68% Probability
FXI 95% Probability
UUP 68% Probability
UUP 95% Probability
TLT 68% Probability
TLT 95% Probability
Securities Mentioned: SPY, FXI, UUP and TLT.
Disclosure: We own SPY and FXI in some managed accounts.
By Richard Shaw
http://www.qvmgroup.com
Richard Shaw leads the QVM team as President of QVM Group. Richard has extensive investment industry experience including serving on the board of directors of two large investment management companies, including Aberdeen Asset Management (listed London Stock Exchange) and as a charter investor and director of Lending Tree ( download short professional profile ). He provides portfolio design and management services to individual and corporate clients. He also edits the QVM investment blog. His writings are generally republished by SeekingAlpha and Reuters and are linked to sites such as Kiplinger and Yahoo Finance and other sites. He is a 1970 graduate of Dartmouth College.
Copyright 2006-2009 by QVM Group LLC All rights reserved.
Disclaimer: The above is a matter of opinion and is not intended as investment advice. Information and analysis above are derived from sources and utilizing methods believed reliable, but we cannot accept responsibility for any trading losses you may incur as a result of this analysis. Do your own due diligence.
Richard Shaw Archive |
© 2005-2022 http://www.MarketOracle.co.uk - The Market Oracle is a FREE Daily Financial Markets Analysis & Forecasting online publication.